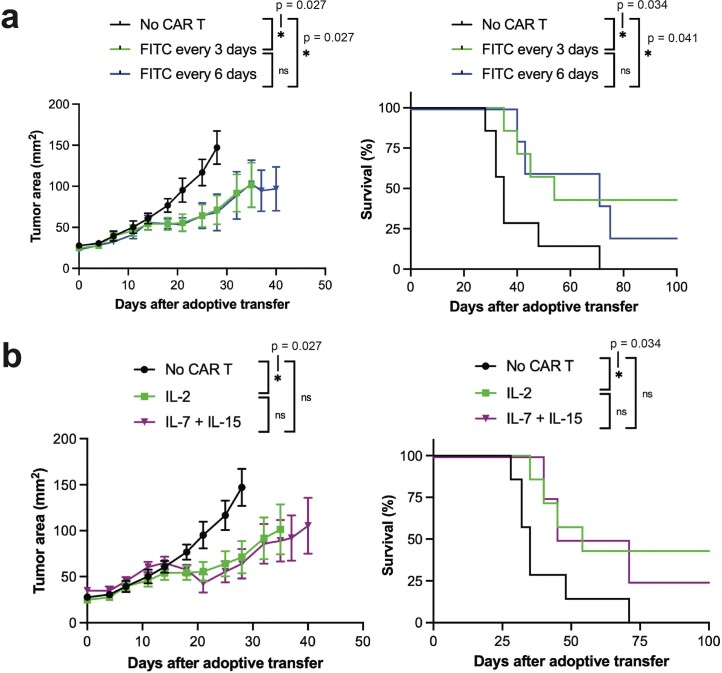
Extended Data Fig. 3. Optimization of FITC CAR T and amph-FITC therapy.
a Comparison of tumour growth (left) and survival (right) in CT-2A tumour-bearing mice treated with CAR T cells followed by intratumoural amph-FITC every 3 or 6 days (n = 5 animals/group). b Comparison of tumour growth (left) and survival (right) in CT-2A tumour-bearing mice treated with FITC CAR T cells prepared in mIL-2 or a combination of mIL-7 and mIL-15 (n = 5 animals/group). P values were determined by two-way ANOVA (tumour growth curves) and log-rank (Mantel-Cox) test (survival curves). Error bars represent standard deviation. n.s., not significant; *p < 0.05, **p < 0.01, ***p < 0.001, ****p < 0.0001.

