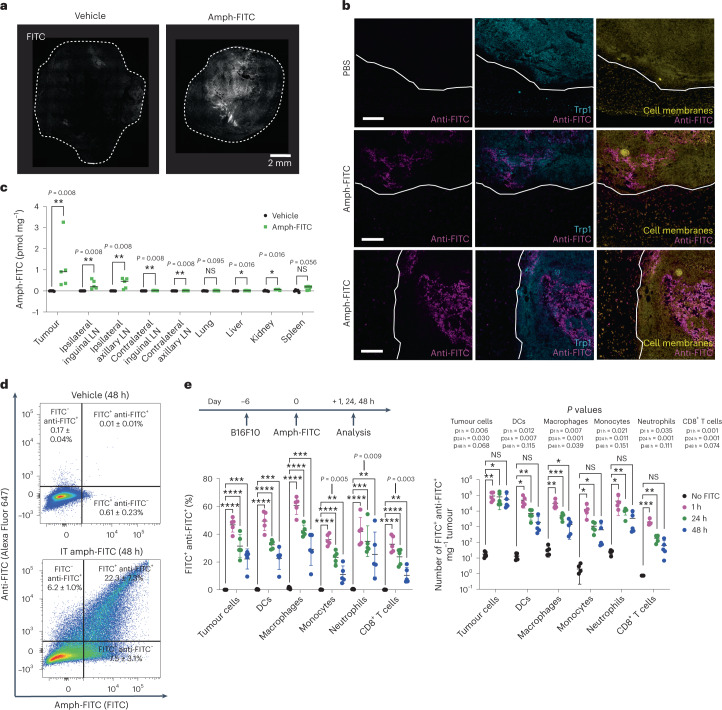
Fig. 2. Intratumoural administration of amph-FITC decorates cancer cells and draining LNs with minimal labelling of other tissues.
C57BL/6 mice were inoculated with 106 B16F10 tumours in the flank, following by i.t. injection of 10 nmol DSPE-PEG2k-FITC when tumours reached 25 mm2 in size. a, Confocal microscopy of B16F10 tumours 24 h after i.t. amph-FITC injection. Shown is one representative histological image from two tumours analysed. b, A total of 106 B16F10 cells were inoculated in C57BL/6 mice (n = 4 per group) and injected intratumourally with 10 nmol amph-FITC when tumours were ~25 mm2 in size. Two hours later, tumours were isolated with neighbouring connective tissue, cryosectioned and stained with anti-Trp1 antibody to identify melanoma cells, anti-FITC and a cell membrane stain. Shown are representative sections from one PBS control and two amph-FITC-injected tumours. Scale bars, 200 μm. c, Biodistribution of amph-FITC 24 h following i.t. injection into B16F10 tumours (n = 5 animals per group). d, Representative flow cytometry plots of amph-FITC-injected B16 tumours (gated on CD45− cells) stained with anti-FITC to detect surface-exposed antigen. e, Immunophenotyping of B16F10 tumours in mice without prior LD at 1, 24 and 48 h following amph-FITC injection, quantifying the proportion of FITC+ anti-FITC+ double-positive cells (left), and density of FITC+ anti-FITC+ cells in the tumour (right) (n = 5 animals per group). All replicates are biological replicates. P values were determined by Mann–Whitney U test (d) or unpaired Student’s t-test (e). Shown are mean ± s.d. NS, not significant; *P < 0.05, **P < 0.01, ***P < 0.001, ****P < 0.0001.

