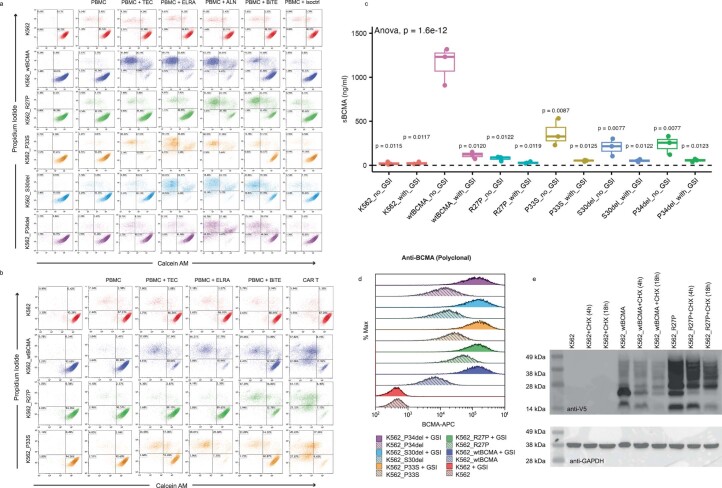
Extended Data Fig. 4. BCMA wild type and mutant K562 cell cytotoxicity assay, soluble BCMA, and protein stability assay.
K562 target cells were pre-stained with CellTrace Violet (CTV) prior to co-culture. Panels (a) and (b) represent representative cytotoxicity assays flow cytometry contour with density plots gated on CTV positive cells. In panel (a), target cells were co-cultured with healthy donor PBMCs at 10:1 effector to target (E:T) ratio ± Teclistamab 1 nM (TEC), Elranatamab 1 nM (ELRA), Alnuctamab 1 nM (ALN), anti-BCMAxCD3 BPS 5.4 nM (BiTE), or isotype control antibody 1 nM (isoctrl). In panel (b), target cells were co-cultured with healthy donor PBMC (E:T = 10:1) ± TCE at 0.1 nM doses or co-cultured with or anti-BCMA CAR T (E:T = 1:1). (c) Soluble BCMA measurement from the supernatant of K562 cell line cultures using sBCMA DuoSet kit. The cell lines were cultured at 1 × 10⁶ cells/ mL ± 6.2 nM gamma secretase inhibitor (GSI) overnight. P-values were generated by t-test comparing each condition to wtBCMA_no_GSI using the R function pairwise.t.test() without adjustments for multiple comparisons. Box plot illustrates median (horizontal line through box), upper hinge (75th percentile, Q3), lower hinge (25th percentile, Q1). Upper hinge extends to Q3 + 1.5 x interquartile range (IQR). Lower hinge whisker extends to Q1-1.5 x IQR. N = 3 biologically independent samples. (d) Surface BCMA expression in K562 or U266 cell lines by polyclonal anti-BCMA antibody by flow cytometry. Cells were treated with or without 6.2 nM GSI overnight. (e) Western blot of cycloheximide chase experiment for estimation of BCMA protein stability. K562 cell lines were treated with or without 10 ug/mL of cycloheximide (CHX) for the indicated times. Cell lysates were collected for western blot for V5 tagged BCMA and GAPDH.

