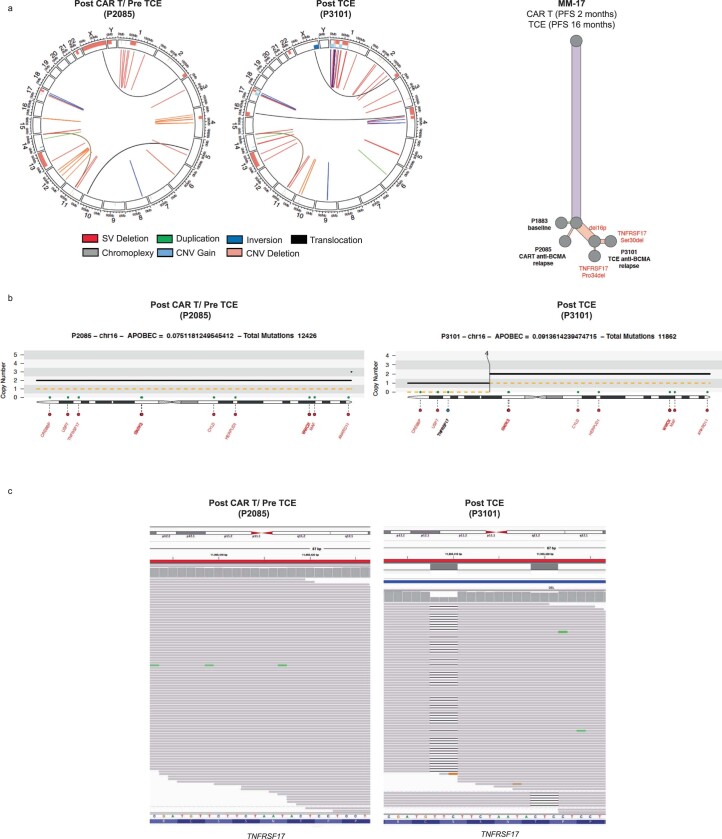
Extended Data Fig. 6. Newly detected p.Pro34del and p.Ser30del BCMA in MM clones at relapse in case MM-17.
(a) Pre-therapy (post CAR T and pre TCE, sample number P2085) versus post-relapse (post TCE, P3101) circos plot based on WGS. Outer track runs clockwise from chromosome 1 to Y. Inner track shows CNVs (gains in light blue, losses in salmon). Lines inside the circle represent SVs (deletions in red, duplications in green, inversions in blue, interchromosomal translocations in black, and chromoplexy in grey). Clonal phylogeny inferred from WGS data. (b) Copy number and structural variations at TNFRSF17 locus. Translocations in black, deletions in red, duplications in green, inversions in blue. (c) IGV screenshot of pre- versus post-relapse CD138+ cells, illustrating newly detected p.Pro34del and p.Ser30del at relapse.

