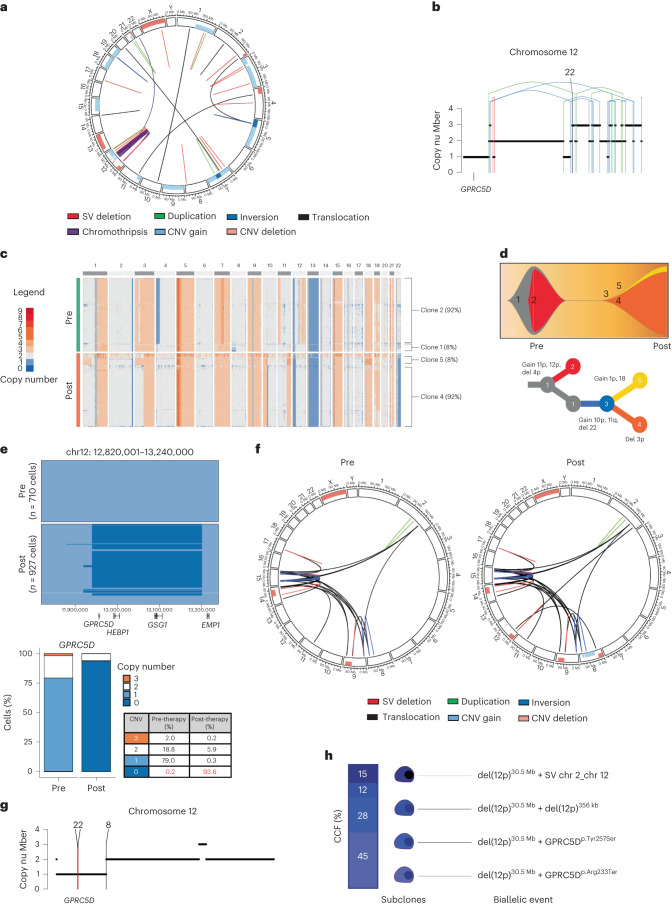
Fig. 6. GPRC5D biallelic loss mediates MM relapse after anti-GPRC5D TCE therapy.
a, Pre-therapy circos plot of patient MM-18 based on WGS. The outer track runs clockwise from chromosome 1 to Y. The inner track shows CNVs (gains in light blue and losses in salmon). The lines inside the circle represent SVs (deletions in red, duplications in green, inversions in blue and interchromosomal translocations in black). b, Illustration of chromosome 12 with CN loss of GPRC5D mediated by a chromothripsis event (translocations in black, deletions in red, duplications in green and inversions in blue) (patient MM-18). c, ScCNV-seq heatmap comparing the CN changes in chromosomes 1–22 in pre-therapy (pre) versus post-relapse (post) CD138+ MM cells (patient MM-18). d, Fish plot of clonal phylogeny of the CD138+ cells at pre-therapy versus post-relapse timepoints inferred from scCNV-seq data. The associated tree illustrates the main alterations differentiating each clone (patient MM-18). e, Pre-therapy versus post-relapse CD138+ CN alteration at the GPRC5D locus based on scCNV-seq. The barplot and table compare the percentages of cells harboring the CNVs in pre- versus post-TCE relapse samples (patient MM-18). f, MM-31 circos plot of WGS data with CNVs and SVs pre-talquetamab treatment and at relapse post-talquetamab treatment. The outer track runs clockwise from chromosome 1 to Y. The inner track shows CNVs (gains in light blue and losses in salmon). The lines inside the circle represent SVs (deletions in red, duplications in green, inversions in blue and interchromosomal translocations in black). g, Illustration of chromosome 12 CNVs and SVs in GPRC5D from WGS (patient MM-31). h, Illustration of cancer cell fractions and subclonal events in the short arm of chromosome 12, resulting in biallelic GPRC5D alteration at relapse (patient MM-31).

