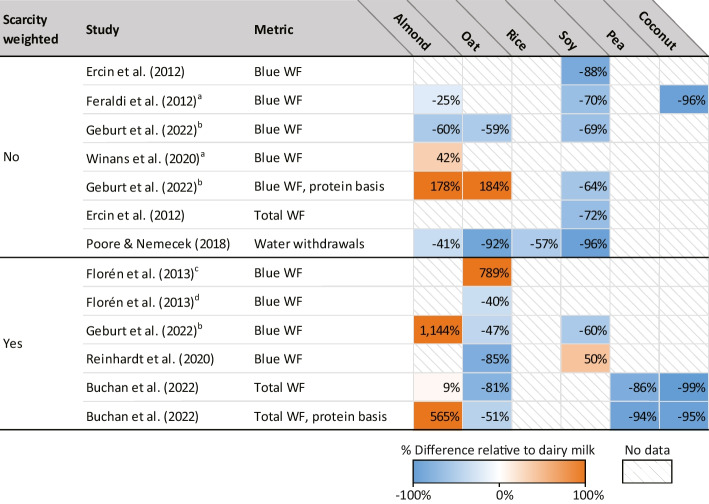
Table 3.
Water use for plant-based milks, relative to dairy milk
Percentages represent the magnitude of plant-based milk water use relative to dairy milk, e.g., in Ercin et al. [79], the estimated blue water footprint of soymilk was 88% lower than that of cow’s milk. Shading indicates whether plant milk water use was higher (orange) or lower (blue) compared to cow’s milk. Comparisons are made on a volume basis (e.g., per liter of milk) unless indicated otherwise (e.g., per gram of protein). See Supplemental Tables S8–S9 for absolute values
aStudy did not include cow’s milk, so we compared plant milk(s) to the weighted global average cow’s milk estimate from Mekonnen and Hoekstra (2010)
bAverage of conventional UHT, organic UHT, conventional non-UHT, and organic non-UHT cow’s milk; average of conventional and organic soymilk
cCow’s milk from Sweden, oat milk from Germany
dCow’s milk from Sweden, oat milk from Sweden

