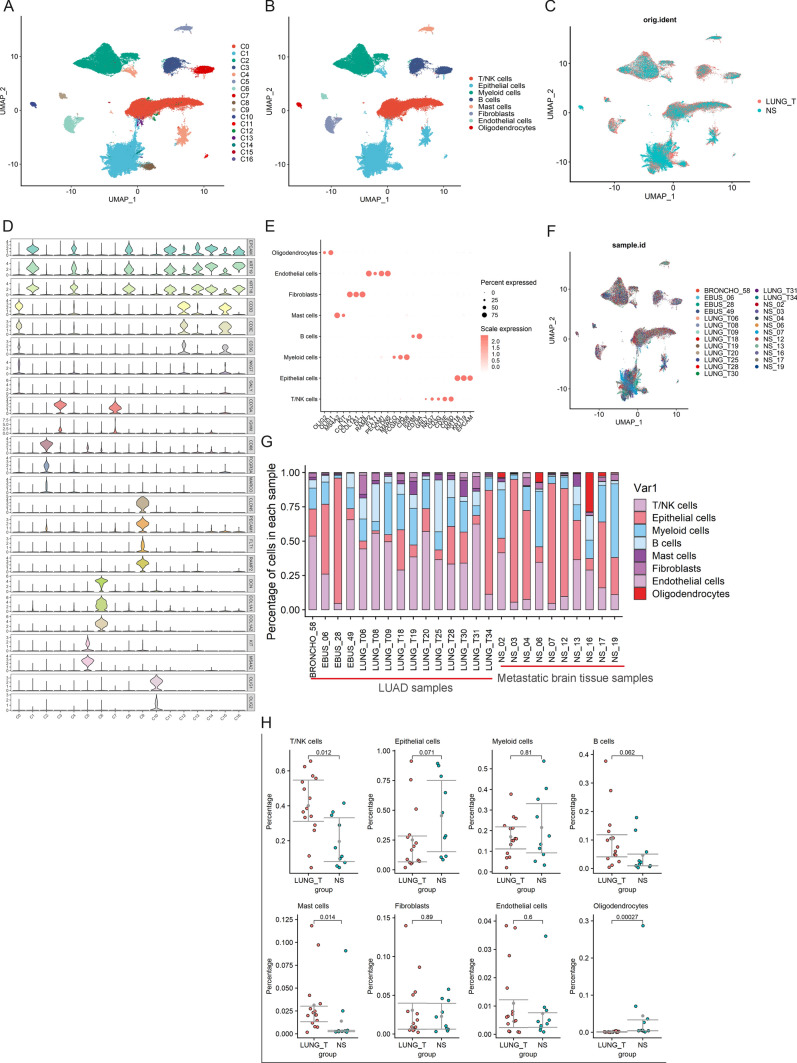
Fig. 1.
Overview of TME in lung adenocarcinoma and brain metastases. A UMAP visualization of all cells displayed with different colours for clusters. B Eight major cell types in lung adenocarcinoma and brain metastases. C Cell distribution in lung adenocarcinoma and brain metastases. D For violin plots, x-axes stand for the number of clusters, y-axes stand for the relative expression level of marker genes. E Marker genes of eight major cell types identified in this study. F The UMAP plot showing sample origin. G The proportion of each cell type in lung adenocarcinoma and brain metastases. H Percentages of the eight cell types among the two groups. Y-axis: average percentage of samples across the two groups. Groups are shown in different colours

