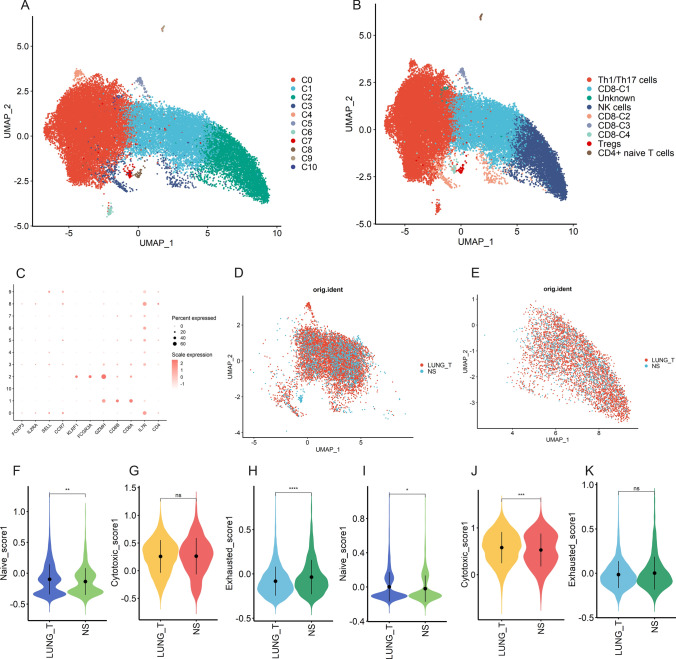
Fig. 2.
Heterogeneity of NK/T cells in lung adenocarcinoma and brain metastases. A UMAP plot shows eleven subclusters of the NK/T cells. B UMAP plot of NK/T cells revealing nine subtypes. C Canonical cell markers used to identify NK/T cell subtypes. D The UMAP plot showing CD8 + T cells origin. E The UMAP plot showing NK cells origin. F–H Violin plot indicating the naive (left), cytotoxic (middle), and exhausted (right) scores of CD8 + T cells from lung adenocarcinoma and brain metastases. I–K Violin plot indicating the naive (left), cytotoxic (middle), and exhausted (right) scores of NK cells from lung adenocarcinoma and brain metastases

