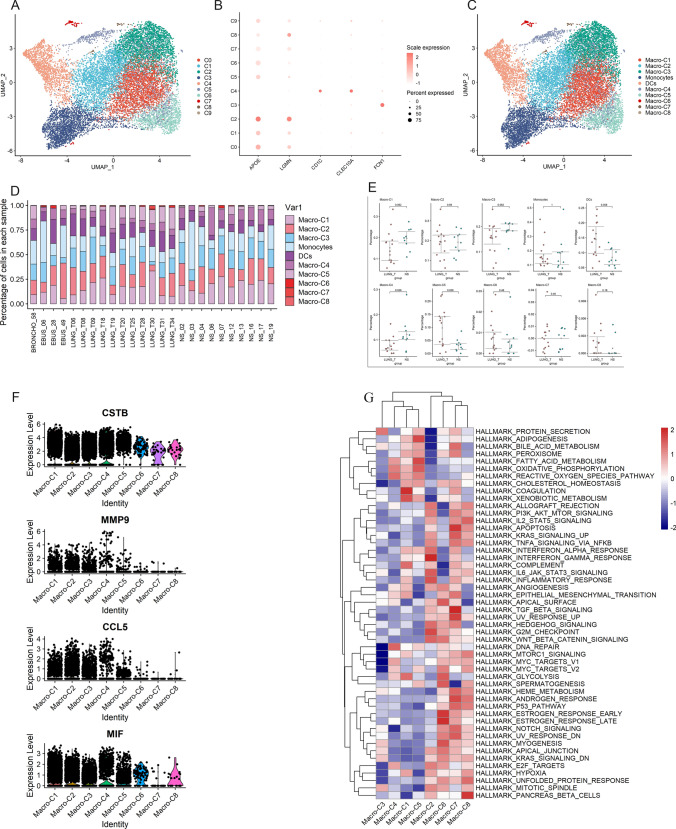
Fig. 3.
Heterogeneity of myeloid cells in lung adenocarcinoma and brain metastases. A UMAP plot shows ten subclusters of the myeloid cells. B Canonical cell markers used to identify myeloid cell subtypes. C UMAP plot of myeloid cells revealing ten subtypes. D The proportion of myeloid cell subtypes in lung adenocarcinoma and brain metastases. E Percentages of each myeloid cell subtype among lung adenocarcinoma and brain metastases. F Violin plots of the expression of several marker genes, including CSTB, MMP9, CCL5, and MIF, in macrophage subtypes. G Differences in pathway activities by GSVA among different macrophage subtypes

