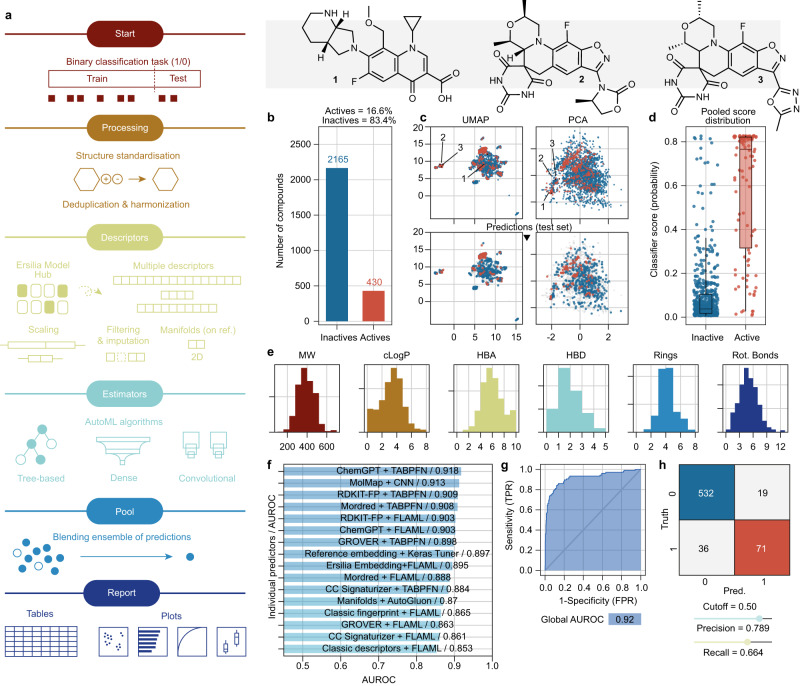
Fig. 1. The ZairaChem pipeline.
a Scheme of the AutoML methodology, consisting of data processing, descriptor calculation, training of models, assembling (pooling) of results, and reporting. b Number of active and inactive compounds in the Mtb MIC90 assay (training set). c Uniform manifold approximation and projection (UMAP) and principal component analysis (PCA) projections of the chemical space in the Mtb MIC90 assay. Structurally different (1 vs 2/3) and similar (2 vs 3) compounds are depicted. Red indicates active compounds; blue indicates inactive compounds. d Model scores (probability of “1”) assigned to the true active (red, n = 107) and inactive (blue, n = 542) compounds in the test set (20% of the total available data). Boxes indicate the median (central line), Q1 (upper bound) and Q3 (lower bound), and whiskers extend to the data points within up to 1.5 times in the interquartile range. e Distribution of common chemical properties of the compounds, namely molecular weight (MW), calculated logP (cLogP), number of hydrogen bond acceptors (HBA), number of hydrogen bond donors (HBD), number of rings (Rings) and number of rotatable bonds (Rot. Bonds). f AUROC scores of the individual ZairaChem predictors. g ROC curve of the final ensemble model. h Confusion matrix showing true positives (red), true negatives (blue), false positives, and false negatives in the test set. Source data are provided as a Source Data file.

