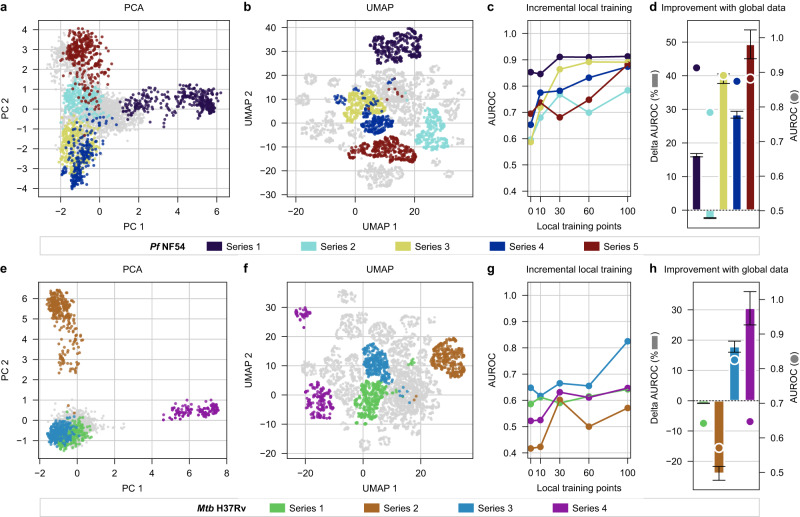
Fig. 3. Model performance within chemical series corresponding to novel regions of chemical space.
PCA and UMAP projections of the chemical space of the H3D Centre’s library for specific chemical series in the malaria (top row) and tuberculosis (bottom row) disease areas. a, e PCA preserves the global distribution of chemical space while b, f UMAP emphasises the clustering of structurally similar data points. c, g Median AUROC scores from a five-fold cross-validation are measured for training sets with an incremental number of local training points for each series, respectively. d, h The percentage of change towards a perfect model (AUROC = 1) between a model trained on a dataset that includes compounds from a more general chemical space versus a model trained on series-specific data alone (see calculation in Methods). The median AUROC score from a five-fold cross-validation, for models trained with both 100 series-specific compounds and global data, is plotted with a circle corresponding to the values of the right-hand-side y-axis. Error bars indicate ± standard deviation (n = 5). Source data are provided as a Source Data file.

