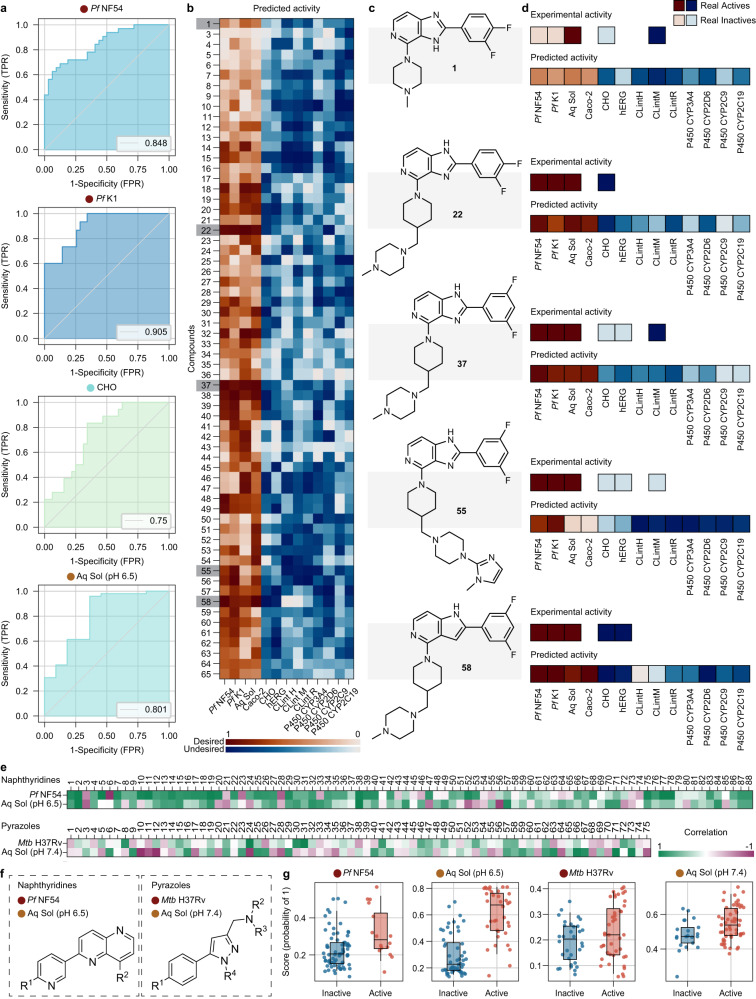
Fig. 4. De novo screening of libraries using AI/ML models.
Upper panel: a ROC curves of ZairaChem models tested on the library of 65 compounds (not included in the training set). Legend indicates the AUROC values of each model. Only models for which experimental validation was available for the 65 molecules are shown. b Predicted scores for each compound, transformed to a scale of 0 to 1 for comparison between assays. Desired activities are shown in a red colour scale and undesired activities are shown in a blue colour scale. Colour maps fade from 1 to 0 according to each model score. c Structure of selected compounds, including the initial hit compound 1. d Comparison of the predicted score and the experimental activity of selected compounds (non-existing squares indicate no experimental data on these assays). Experimental activity is represented as 1 (dark blue or dark red) or 0 (light blue, light red) for desired and undesired assay outcomes, respectively. Lower panel: Prospective validation for two active chemical series at H3D; naphthyridines active against Pf and pyrazoles targeting Mtb. e Model performance is depicted through correlations of model predictions with experimental results in which a green cell represents a correct model prediction while purple cells indicate incorrect predictions. f The core scaffold for each series is depicted as well as g a swarm plot for individual compound predictions. n active/inactive: Pf NF54 16/72, Aq Sol pH6.5 36/52, Mtb H37Rv 43/32, Aq Sol pH7.4 54/21. Boxes indicate the median (central line), Q1 (upper bound) and Q3 (lower bound) and whiskers extend to the data points up to 1.5 times in the interquartile range. Source data are provided as a Source Data file.

