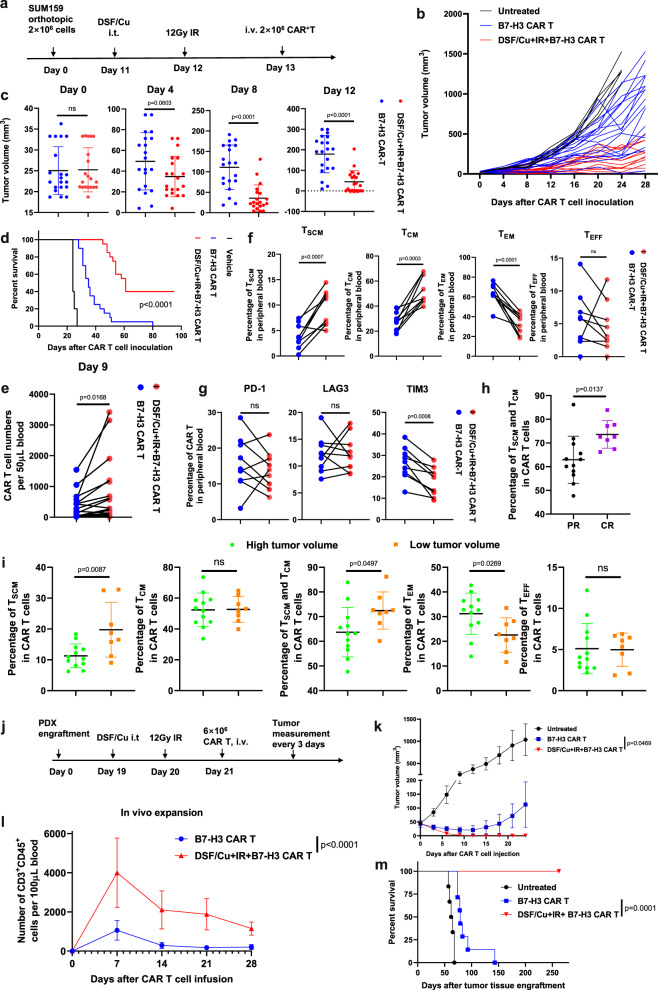
Fig. 6. Robust and long-sustained therapeutic responses against solid tumors by RP B7-H3 CAR T derived from PBMCs of patients with metastatic breast cancer.
a Schema of TNBC orthotopic xenograft model (SUM159) infused with CAR T. b Tumor volumes (untreated n = 5, CAR T n = 20, DSF/Cu+IR + CAR T n = 20) measured every 4 days. c Comparison of tumor volumes in mice treated with the same patient’s PBMC-derived CAR T vs. DSF/Cu+IR + CAR T on days 0, 4, 8, 12 post-CAR T infusion (CAR T n = 20, DSF/Cu+IR + CAR T n = 20). d Kaplan–Meier survival curve of mice (untreated n = 5, CAR T n = 20, DSF/Cu+IR + CAR T n = 20). e Frequency of B7-H3 CAR T cells in peripheral blood 9 days post-CAR T injection (CAR T n = 20, DSF/Cu+IR + CAR T n = 20). f Early memory B7-H3 CAR T, defined by CD45RA and CD62L on CD3+ in peripheral blood collected from mice 10 days after the CAR T infusion. Percentages of TSCM/TCM/TEM/TEFF CAR T are shown (n = 9). g Frequency of B7-H3 CAR T expressing markers associated with T-cell exhaustion (CD3+PD-1+, CD3+LAG3+, or CD3+TIM3+ in peripheral blood collected from treated mice 9 days post CAR T injection (n = 9/group). h Comparison of percentages of circulating TSCM and TCM of B7-H3 CAR T in tumor-bearing mice with complete response (CR) vs. partial response (PR) 24 days post CAR T infusion (CR: n = 12, PR: n = 8). i Reverse correlation of percentages of early/effector-memory NRPB7-H3 CAR T with tumor burden (high tumor volume group n = 12; low tumor volume group n = 8). j Schema of TNBC-PDX mouse model. k, Tumor volumes (vehicle n = 6; the other two groups n = 7) of each group. l Frequency of B7-H3 CAR T cells (CD3+CD45+) in the blood of mice collected weekly (n = 7/group). m Kaplan–Meier survival curve of mice (vehicle n = 6; the other two groups n = 7). Data “n” represents biological replicates. Statistical comparisons were performed using a two-tailed unpaired t-test (c, h, i), log-rank test (d, m), two-tailed paired t-test (e, f, g), and two-way ANOVA with Tukey’s multiple comparisons test (k, l). P-values are shown and error bars indicate mean ± SD. Source data are provided as a Source Data file.

