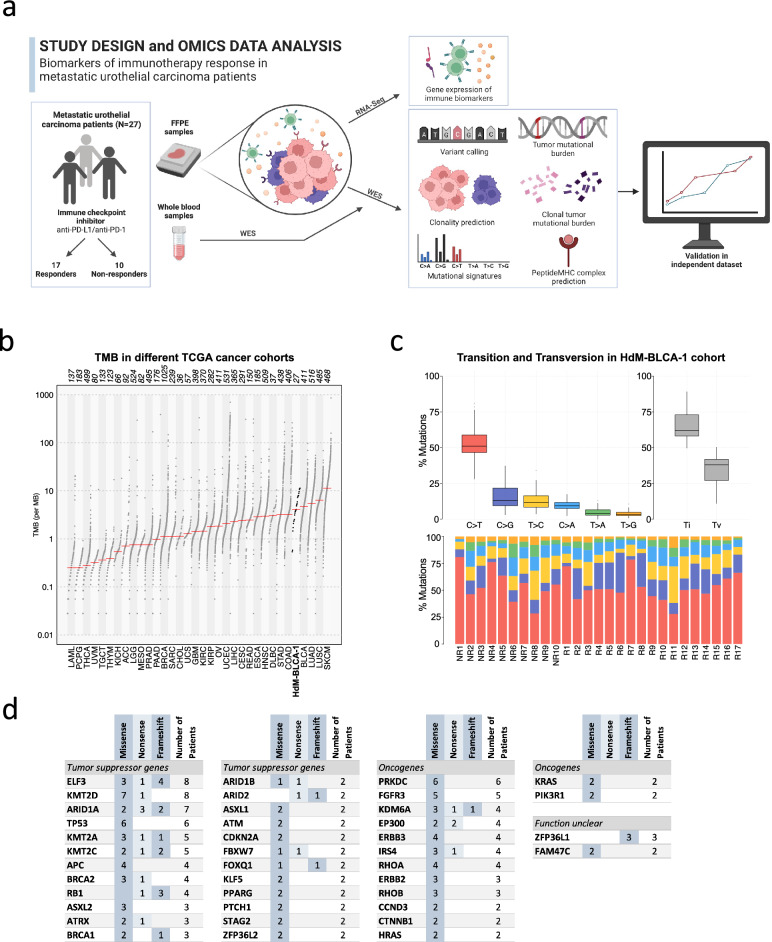
Figure 1.
Analysis of omics data from the metastatic urothelial cancer cohort at Hospital del Mar. (a) Study design. We performed whole exome sequencing (WES) and RNA sequencing (RNA-Seq) from a cohort of 27 patients. The cohort included 17 responders (partial or complete response) and 10 non-responders (progressive disease). We measured the differences in the distribution of several biomarkers, including clonal and subclonal TMB, mutational signatures, number of predicted mutation-induced neoantigens and gene expression signatures in responders and non-responders. Created with BioRender.com. (b) Tumor mutational burden (TMB) compared to different TCGA cancer cohorts. The number of non-synonymous mutations in the cohort in our cohort (HdM-BLCA-1) was very similar to the bladder cancer TCGA cohort and in accordance with this being a highly mutated cancer. The names below the plot represent the TCGA cohort abbreviation, the numbers above represent the cohort sizes. (c) Frequencies of different pairwise nucleotide substitutions. C->T mutations were the most frequent ones, followed by C->G. TI transition, Tv transversion. (d) Cancer-related frequently mutated genes. Missense, frameshift and nonsense mutations are shown. Genes have been classified into ‘Oncogenes’, ‘Tumor suppressor genes’ and ‘Function unclear’ based on previous knowledge. NR no responders, R responders.

