Figure 2.
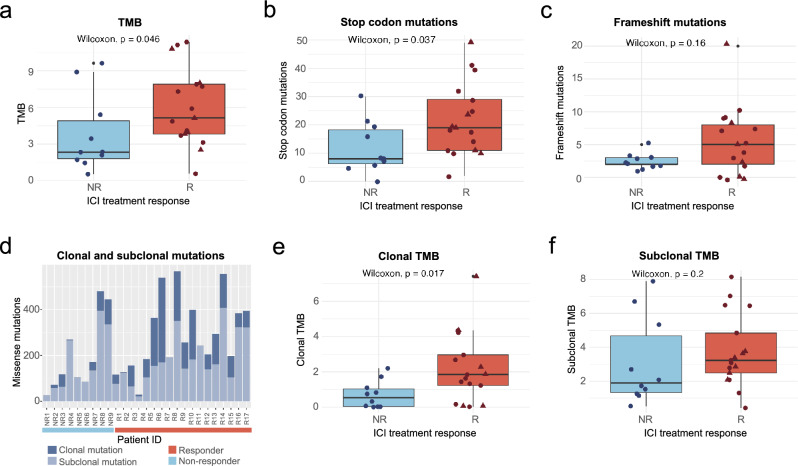
TMB and clonal TMB are significantly associated with the response to ICI. (a) Relationship between TMB and response to ICI treatment. TMB values were significantly higher in responders than in non-responders (Wilcoxon test, p value = 0.046). (b) Relationship between stop mutations and response to ICI treatment. Nonsense mutations were significantly higher in responders than in non-responder (Wilcoxon test, p value = 0.037). (c) Relationship between frameshift mutations and response to ICI treatment. Frameshift mutations showed a trend of being more abundant in responders than non-responders but the difference was not statistically significant (p = 0.3). (d) Number of mutations per patient divided in clonal and subclonal. The proportion of clonal mutations is significantly higher in responders (Fisher’s exact test p value = 0.007). (e) Relationship between clonal TMB and response to ICI treatment. Clonal TMB values were significantly higher in responders than in non-responders (Wilcoxon text, p value = 0.017). (f) Relationship between subclonal TMB and response to ICI treatment. Responders tend to have higher values but the difference between responders and non-responders is not statistically significant. NR no responders, R responders, triangle shape represents complete responders among the group of responders.

