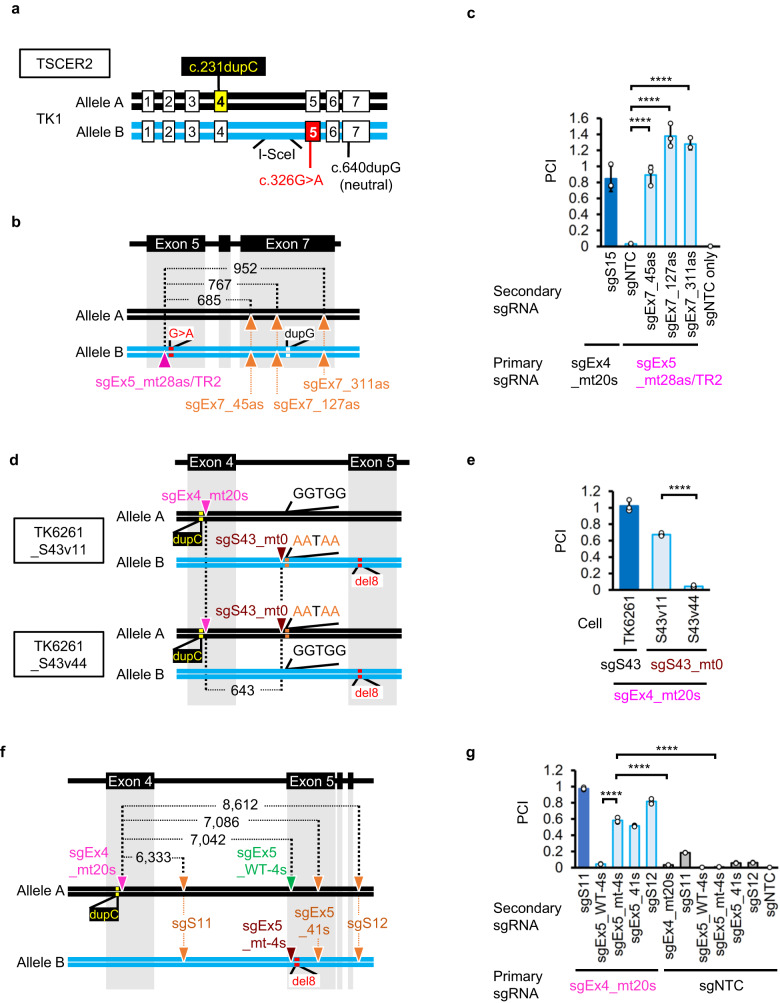
Fig. 3. Efficient MN-IHR occurs with nicks on both homologous chromosomes.
Gene correction efficiency was evaluated using a proliferation assay. a A schematic illustration of compound heterozygous mutations in the TK1 gene in TSCER2 cells. b, c A missense mutation in exon 5 was corrected by introducing MNs on the antisense strand of the TK1 gene in TSCER2 cells. b A schematic illustration of mutations and nicked sites (indicated by triangles). c Mean PCI ± SD from three independent experiments. The standard sample was TK6261_EGFP cells electroporated with sgEx4_mt20s, sgS15, and Nickase (dark-blue bar). The test samples were TSCER2 cells electroporated with the indicated sgRNAs and Nickase. d, e The mutation in exon 4 was corrected by either SNs on both alleles or two nicks on allele A. d A schematic illustration of mutations and nicked sites (inverted triangles). e Mean PCI ± SD from three independent experiments. The standard sample was TK6261_mCherry cells electroporated with sgEx4_mt20s, sgS43, and Nickase (dark-blue bar). The test samples were TK6261, TK6261_S43v11, and TK6261_S43v44 cells electroporated with the indicated sgRNAs and Nickase. f, g Mutations in exon 4 and/or 5 of the TK1 gene in TK6261 cells were corrected by introducing MNs. f A schematic illustration of mutations and nicked sites (inverted triangles). g Mean PCI ± SD from three independent experiments. The standard sample was TK6261_mCherry cells electroporated with sgEx4_mt20s, sgS11, and Nickase (dark-blue bar). The test samples were TK6261_EGFP cells electroporated with the indicated sgRNAs and Nickase. dupC, c.231dupC; del8, c.311_318del; G>A, c.326G>A; dupG, c.640dupG. I-sceI is the I-sceI recognition sequence. Data were analyzed using a one-way ANOVA followed by Dunnett’s multiple comparison test (two-sided). F (5, 12) = 98.19 (c), F (2, 6) = 446.1 (d), or F (11, 24) = 1909 (g). ****P < 0.0001. Source data were provided as a Source Data file.

