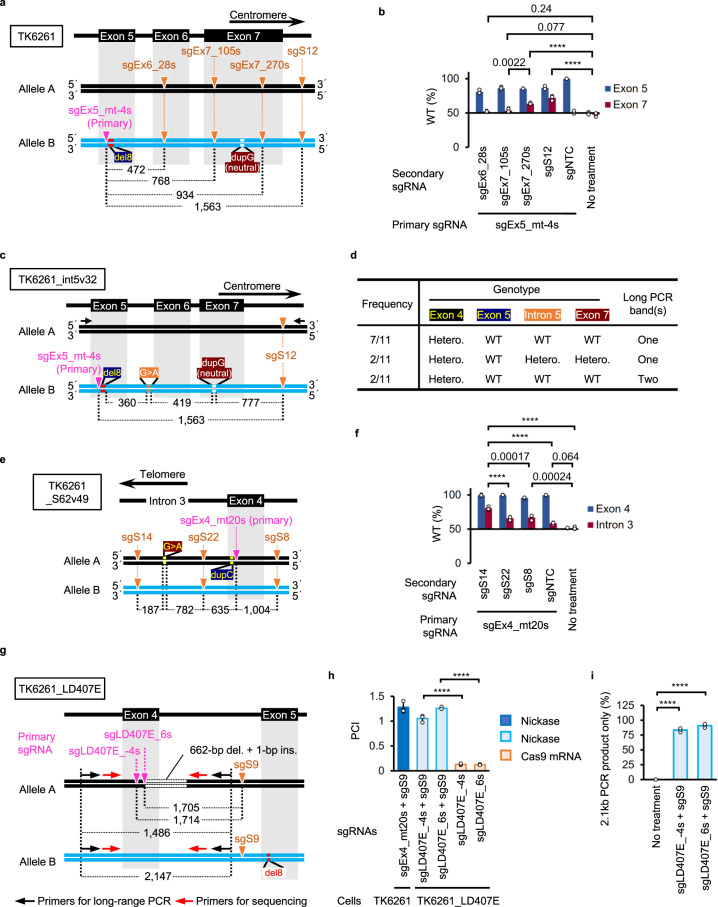
Fig. 4. Secondary nicks both extend and restrict the incorporation of DNA sequences from the donor allele to the recipient allele in MN-IH-HR.
a, c, e, g Schematic illustrations of mutations, nicked sites, and primers. a, b, e, f Cell populations with TK1 activity were enriched in CHATM and subjected to AmpNGS for the regions surrounding exons 4 (f), 5 (b), and 7 (b) and intron 3 (the region surrounding the target site of sgS62, f) of the TK1 gene. b, f Percentage of reads with WT sequences (mean ± SD from three independent experiments). TK6261 (b) and TK6261_S62v49 (f) cells were electroporated with the indicated sgRNAs and Nickase. c, d Exon 4, intron 5, and exon 7 genomic DNA sequences and long-range PCR of 11 exon 5-corrected TK6261_int5v32-derived SCCs. d Frequency of SCCs with the indicated genotypes. Hetero.: heterozygote. g–i The long deletion in TK6261_LD407E cells was corrected by NICER. Mean PCI ± SD from three independent experiments. The standard sample was TK6261_mCherry cells electroporated with sgEx4_mt20s, sgS9, and Nickase (dark-blue). The test samples were TK6261_LD407E cells electroporated with either Nickase or Cas9 mRNA, accompanied by the respective sgRNAs indicated in the graph (h). Percentage of TK1 activity-positive SCCs showing only 2.1-kb PCR products in long-range PCR (mean ± SD from three [94 clones/experiment] independent experiments). The proportion data were adjusted using the following formula: AdX = (X + 10−10)/(1 + 2 × 10⁻¹⁰), where X is the original proportion and AdX is the adjusted proportion (i). The original proportion data (b, e) and adjusted proportion data (i) were transformed into a continuous scale using probit transformation and subjected to a one-way ANOVA followed by Tukey’s (b, f, h) or Dunnett’s (i) multiple comparison test (two-sided). F (5, 12) = 48.72 (b), F (4, 10) = 59.09 (f), F (4, 10) = 289.1 (h) or F (2, 6) = 3,129 (i). Exact P-values are shown in the graphs (b, f). ****P < 0.0001. dupC, c.231dupC; del8, c.311_318del; dupG, c.640dupG; G>A, SNV at the target site of sgS62. Source data were provided as a Source Data file.

