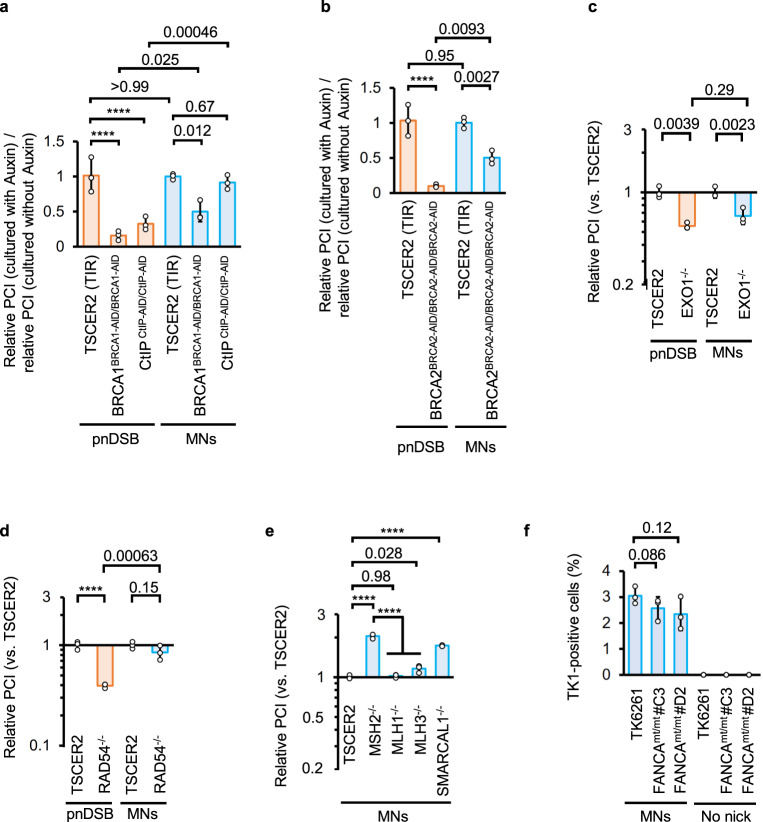
Fig. 6. Mechanistic insights into MN-IH-HR.
Recovery efficiency of TK1 activity in DNA repair-related gene knockout, knockdown, and mutated cells. MNs were introduced using Nickase with sgEx4_mt20s and sgS14 (light blue bars). pnDSB was introduced using Nickase with sgEx4_mt20s and sgEx4_88as (orange bars). The standard samples were TK6261_EGFP (a, d, e) or TK6261_mCherry (b, c) cells. a, b Ratio of the relative PCI of auxin-treated cells (1 = average PCI in TSCER2 [TIR] treated with auxin) to that of untreated cells (1 = average PCI in TSCER2 [TIR] not treated with auxin) in a proliferation assay. To deplete AID-tagged BRCA1, BRCA2, or CtIP, cells were treated with auxin starting half a day prior to electroporation, and treatment was continued for two days post-electroporation. c–e Relative PCIs (1 = average PCI in TSCER2) in the proliferation assay. The vertical axis represents a logarithmic scale. f Percentage of TK1 activity-positive cells determined by the colony formation assay. Data represent the mean ± SD from three independent experiments. Data were analyzed using a two-way ANOVA with Šídák’s multiple comparisons test (a–d) (two-sided) or a one-way ANOVA followed by Tukey’s (e) or Dunnett’s (f) multiple comparisons test (two-sided). F = 230.2 (e) or 3.159 (f). F (1, 12) = 23.77 (silenced gene, a), F (2, 12) = 39.15 (type of DNA damage, a), F (1, 8) = 6.421 (silenced gene, b), F (1, 8) = 95.24 (type of DNA damage, b), F (1, 8) = 1.205 (EXO1 knockout, c), F (1, 8) = 64.80 (type of DNA damage, c), F (1, 8) = 18.13 (RAD54 knockout, d), F (1, 8) = 50.69 (type of DNA damage, d), F (4, 10) = 230.2 (e), or F (3, 9) = 3.159. Exact P-values are shown in the graphs. ****P < 0.0001. Source data were provided as a Source Data file.

