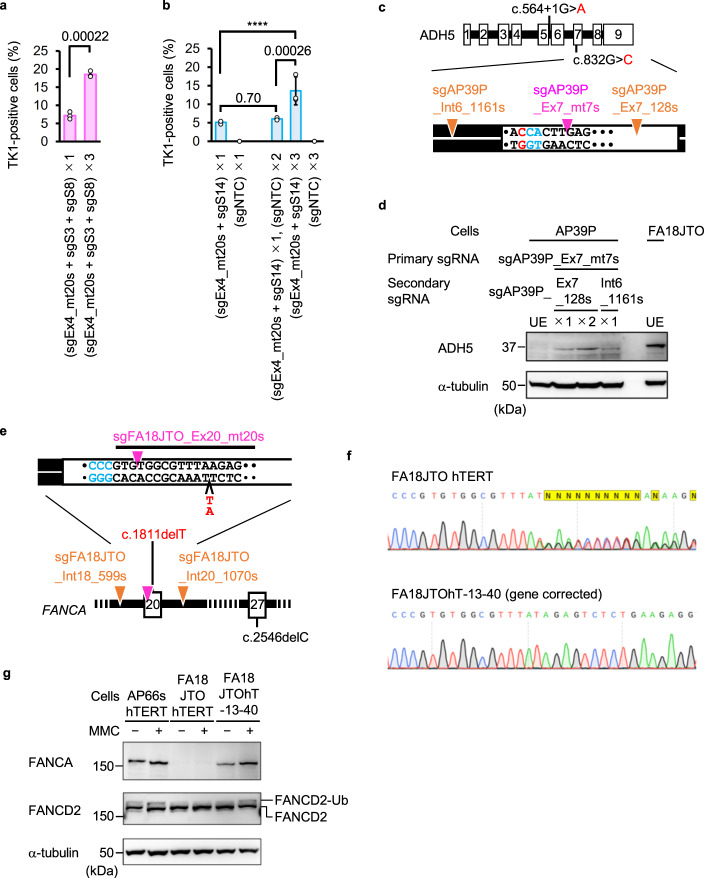
Fig. 8. MNs recovered the expression of gene products encoded by genes mutated in hereditary disease-derived cells.
a, b Percentage of TK1 activity-positive cells determined using a colony formation assay. The ×1, ×2, and ×3 labels indicate that cells were electroporated with the specified sgRNAs and Nickase once, twice, or three times, respectively. Data represent the mean ± SD from three independent experiments. The proportion data were adjusted using the following formula: AdX = (X + 10−10)/(1 + 2 × 10⁻¹⁰), where X is the original proportion and AdX is the adjusted proportion (b). The original proportion data (a) and adjusted proportion data (b) were transformed into a continuous scale using probit transformation and subjected to a two-tailed unpaired t-test (a, t = 12.68, df = 4) or a one-way ANOVA followed by Tukey’s multiple comparisons test (b, two-sided, F [4, 10] = 3,676). Exact P-values are shown in the graphs. ****P < 0.0001. c, d The mutation in exon 7 of the ADH5 gene in AP39P cells was corrected by NICER. c A schematic illustration of mutations of the ADH5 gene in AP39P cells and sgRNA target sites (inverted triangles). d Immunoblotting for ADH5 protein in cells before (unedited [UE]) or after NICER using the specified sgRNAs. The ×1 and ×2 labels indicate that the cells underwent NICER once and twice, respectively. FA18JTO cells were used as positive controls for ADH5 protein expression. Data represent three independent experiments. e–g The mutation in exon 20 of the FANCA gene in FA18JTO hTERT cells was corrected by NICER. e A schematic illustration of mutations in the FANCA gene in FA18JTO hTERT cells and target sites of sgRNAs (inverted triangles). f Sanger sequencing data from FA18JTO hTERT and FA18JTOhT-13-40 cells. g Immunoblotting for FANCA and FANCD2 proteins in the specified cells before or after treatment with mitomycin C (MMC) is presented. AP66S hTERT cells were used as a positive control for FANCA expression. FANCD2-Ub, monoubiquitinated FANCD2. Data represent three independent experiments. Source data were provided as a Source Data file.

