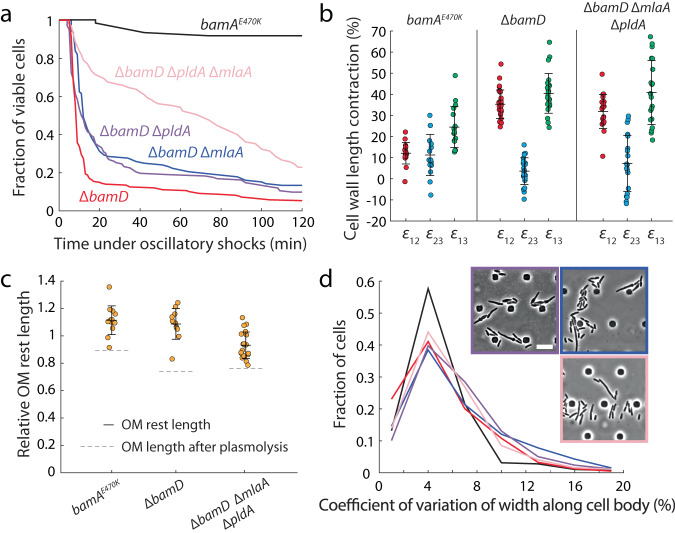
Fig. 4. Replacement of proteins with PLs does not restore cell shape or OM stiffness.
a Lysis due to oscillatory hyperosmotic shocks (cycles of 1 min in LB and 1 min in LB + 400 mM sorbitol; Methods) is partially rescued by deletion of both pldA and mlaA. Shown are measurements of the fraction of viable cells from time-lapse images in a microfluidic flow cell. n = 60 for bamAE470K; n > 100 cells for all other strains. b ΔbamD and ΔbamD ΔpldA ΔmlaA cells have lower OM stiffness than the parent strain. Shown are measurements of cell wall length contraction from the turgid state to plasmolyzed state after addition of 1 M sorbitol (ε12), from the plasmolyzed state to lysed state after addition of detergent (ε23), and from the turgid state to the lysed state (ε13) (Methods). ε12 and ε23 are higher and lower, respectively, in ΔbamD and ΔbamD ΔpldA ΔmlaA compared with the parent strain, suggesting that the OM in the two mutants is not as able to resist contraction upon turgor release. Data are presented as mean values ± 1 standard deviation. Sample sizes: n = 17 for bamAE470K, n = 24 for ΔbamD (plus 6 cells for ε12 only), n = 20 for ΔbamD ΔpldA ΔmlaA. c The OM rest length is similar to that of the turgid cell in bamAE470K, ΔbamD, and ΔbamD ΔpldA ΔmlaA cells, indicating that the OM of all strains have a similar amount of material. Shown is the ratio of the OM size of a spheroplast compared to the turgid OM area (Methods). In all three strains, the OM rest length is substantially larger than a cell after plasmolysis (ratio of OM length after plasmolysis to the turgid length is shown as grey dashed lines). N = 1 biological replicate. Data are presented as mean values ± 1 standard deviation. Sample sizes: n = 13 for bamAE470K, n = 11 for ΔbamD, n = 20 for ΔbamD ΔpldA ΔmlaA. d Cell shape defects due to bamD deletion are not rescued in the suppressor strains ΔbamD ΔpldA, ΔbamD ΔmlaA, and ΔbamD ΔpldA ΔmlaA. All three strains exhibited higher coefficient of variation in cell width along the cell body compared to the parent. Lines are colored by strain as in (a). n > 200 cells for each strain. Insets: cells were imaged during log-phase growth in a microfluidic flow cell. Scale bar: 10 µm.

