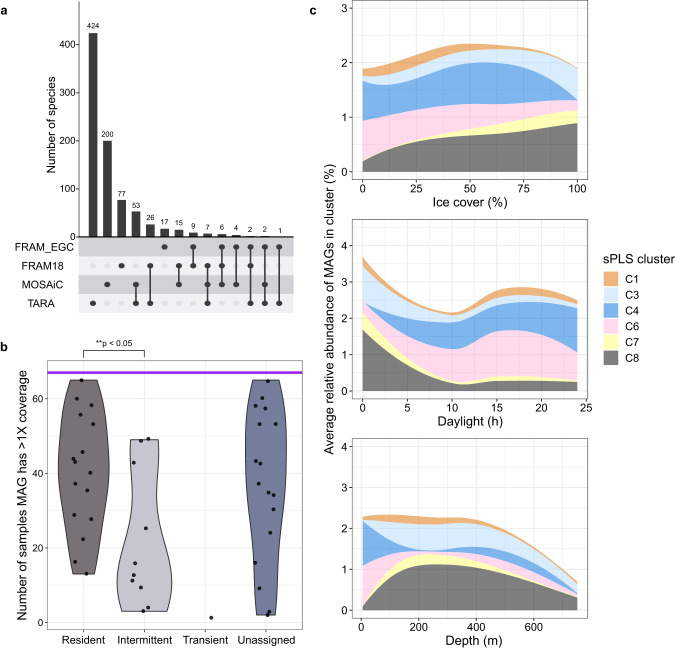
Fig. 5. Comparison and dynamics of MAGs across the Fram Strait and Arctic Ocean.
We compared metagenome-assembled genomes (MAGs) generated in this study (FRAM_EGC), and from samples previously collected in the Fram Strait (FRAM18) [23], in the Arctic Ocean during summer (TARA) [34], and in the Arctic Ocean during winter (MOSAIC) [35]. a Number of shared and unique species across the four MAG datasets, determined by comparisons at 95% average nucleotide identity threshold. b Number of metagenomes in which FRAM_EGC MAGs were detected with at least 1× coverage. The horizontal purple line represents the total number of samples (n = 67). c Average relative abundance of sPLS clusters (Fig. 4) across different ice cover, daylight and depth values determined by read recruitment from Arctic Ocean and Fram Strait metagenomes to the respective FRAM_EGC MAGs. The ~4000 m sample from MOSAiC was not included.

