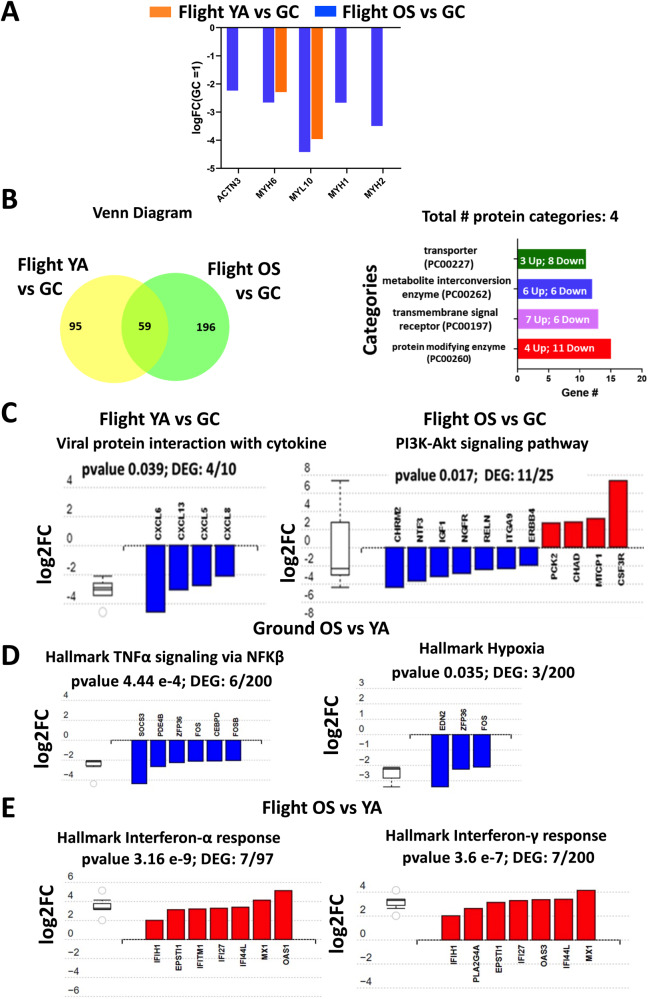
Fig. 2. Transcriptional responses of muscle myobundles during flight and ground culturing conditions.
A Comparative analysis of differential gene expression changes between flight and ground controls of genes involved in muscle myogenesis and contraction YA (orange bars) and OS (blue bars). B Panther classification system of the 59 shared genes shown in the Venn diagram for overlapping and distinct DEGs among Flight YA vs GC and Flight OS vs GC datasets. The horizontal bar chart identifies the four protein classes and relative number of DEGs of each functional class by applying a cut-off threshold of 10 genes. C Significantly enriched KEGG pathways in response to flight either in YA- or OS-derived myobundles relative to their respective ground controls. Significantly affected “hallmark” gene sets from the Molecular Signature Database for (D). Ground OS vs YA and (E). Flight OS vs YA (MSigDB). C, D, E The box and whisker plots on the left summarize the distribution of all the differentially expressed genes in the two pathways. The box represents the 25–75 quartile with a median line, the whiskers show the top and bottom 25% of the data, while the outliers are represented by doted lines. RNA-Seq analysis measured distinct three individual chips each containing one myobundle derived from 5 male donor cells pooled in equal ratios.

