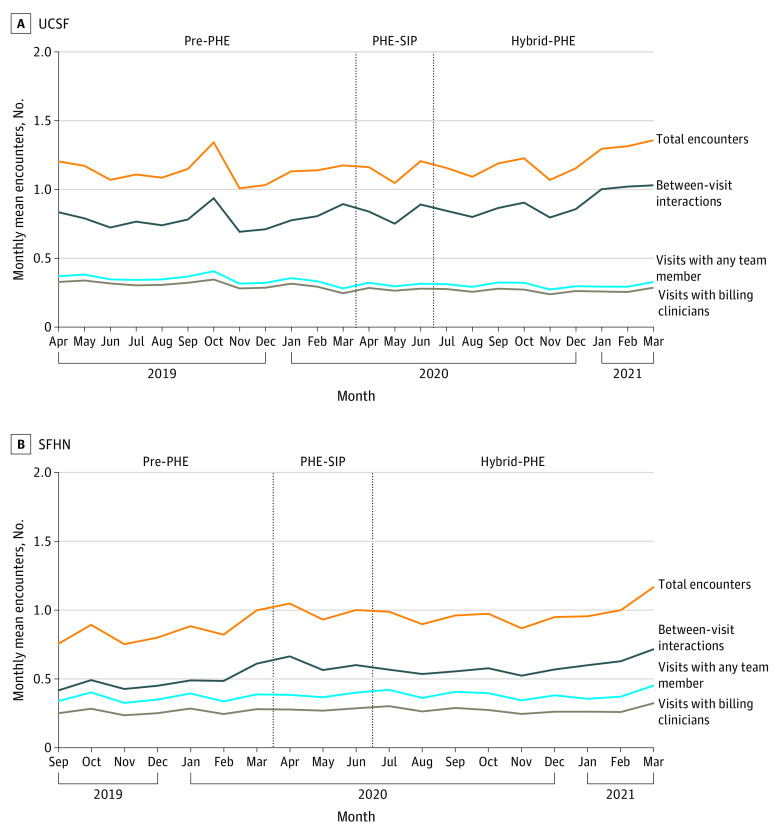
Figure 1. Mean Number of Patient-Clinician Encounters per Month Among 5268 Patients Receiving Care at University of California San Francisco (UCSF) and 9880 Patients Receiving Care at San Francisco Health Network (SFHN) From April 2019 to March 2021.
Visits with any team member include in-person, video, or phone visits with any member of the care team. Visits with billing clinicians include any in-person, video, or phone visit with billing clinicians (physicians, advance practice practitioners). Between-visit interactions include any unscheduled phone call or patient portal message with any member of the care team. Total encounters equals visits with any team member and between-visit interactions. Pre-PHE indicates pre–COVID-19 public health emergency, April 1, 2019, to March 31, 2020, at UCSF; September 1, 2019, to March 31, 2020, at SFHN; PHE-SIP, public health emergency shelter in place, April 1 to June 30, 2020; and hybrid-PHE, hybrid public health emergency, July 1, 2020, to March 31, 2021.

