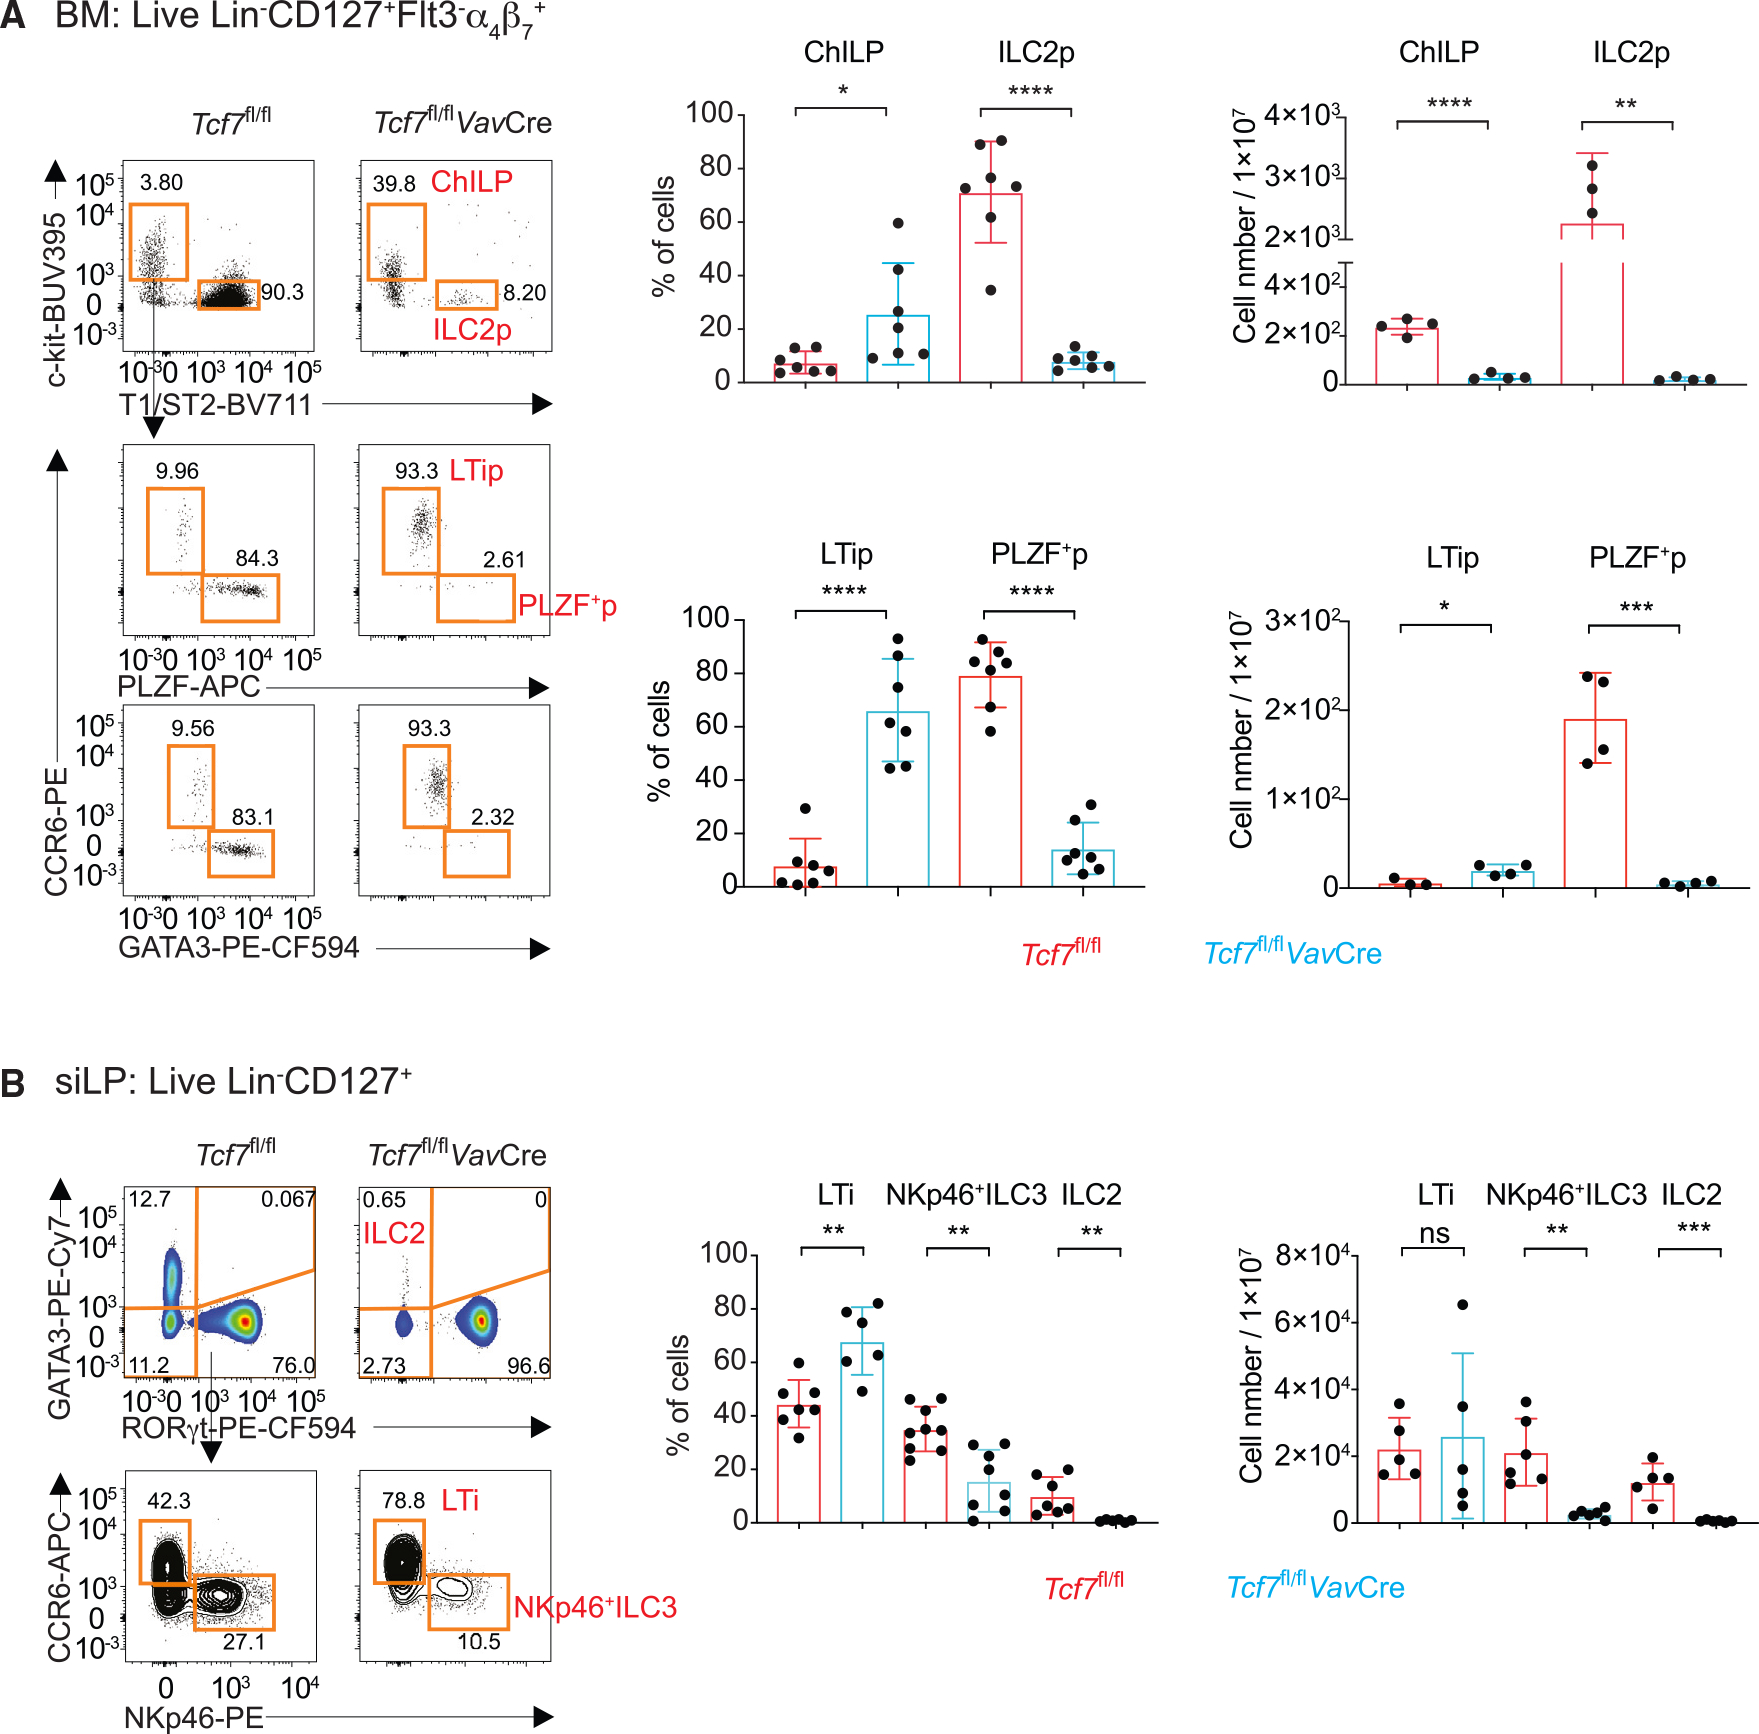
Figure 1. TCF-1 is critical for the development of non-LTi ILCs but not LTi cells.

(A) BM cells were isolated from WT and Tcf7fl/flVavCre mice, and ILC2p, LTip, and PLZF+ ILC progenitor populations were analyzed by flow cytometry. Bar graphs show quantification in percentages and total cell numbers.
(B) ILC (Lin−CD127+) population in the siLP of the Tcf7fl/flVavCre mice were characterized by intracellular GATA3 and RORγt staining. The RORγt+ ILC3s were further analyzed based on their CCR6 and NKp46 expression. Bar graphs show quantification in percentages and total cell numbers. Bar graphs show quantification of total LTi cell numbers. *p < 0.05; **p < 0.01; ***p < 0.001; ****p < 0.0001; ns, not significant, Student’s t test. Data are representative of at least three independent experiments. See also Figure S1.
