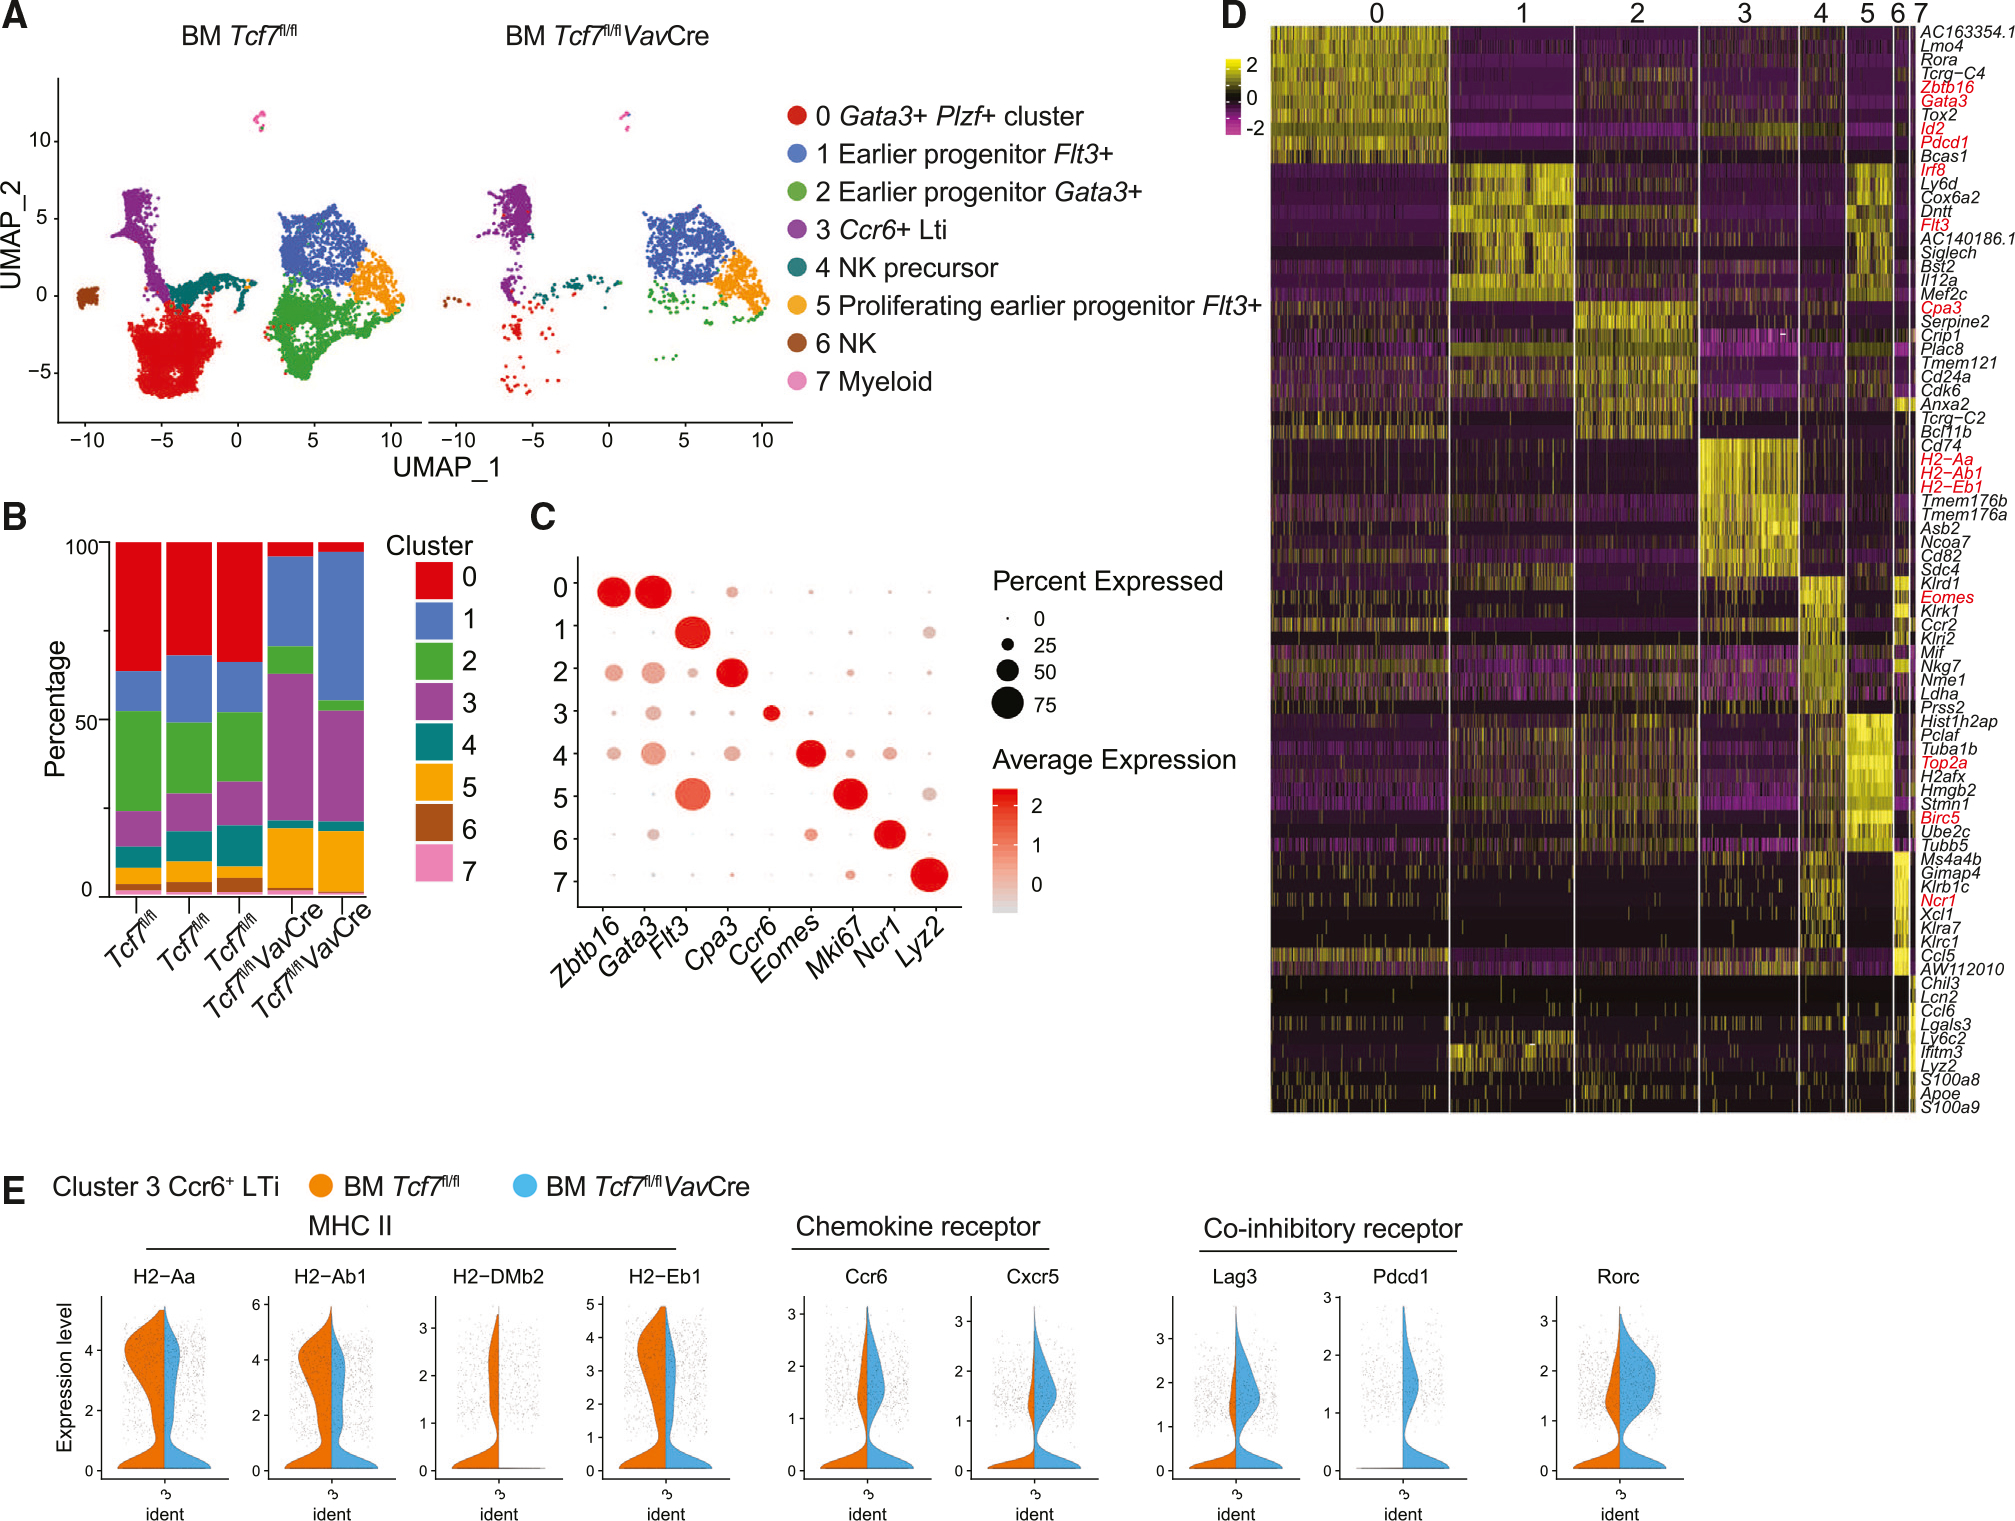
Figure 2. scRNA-seq analysis reveals altered gene expression in the TCF-1-deficient LTiPs.

(A) The UMAP plot of ILCPs from WT and Tcf7fl/flVavCre mice. Each dot corresponds to one individual cell. A total of eight clusters (clusters 0–7) were identified and color coded.
(B) Percentages of each cluster in three WT mice and two Tcf7fl/flVavCre mice.
(C) Dot plots of gene ontology. Each row represents one cluster; each column represents a key gene. The average expression level is color-coded. The expression percentages are represented by the diameter of the circles.
(D) Heatmap of the top 10 genes expressed in each cluster as defined in (A). The columns correspond to the clusters; the rows correspond to the genes. Cells are grouped by clusters. The color scale is based on a Z score distribution from −2 (purple) to 2 (yellow).
(E) Violin plots of MHCII, chemokine receptor Ccr6 and Cxcr5, co-inhibitory receptor Lag3 and Pdcd1, and Rorc expression in WT and Tcf7fl/flVavCre LTi cells. The violin represents the probability density at each value. Data are representative of two independent experiments. See also Figure S2.
