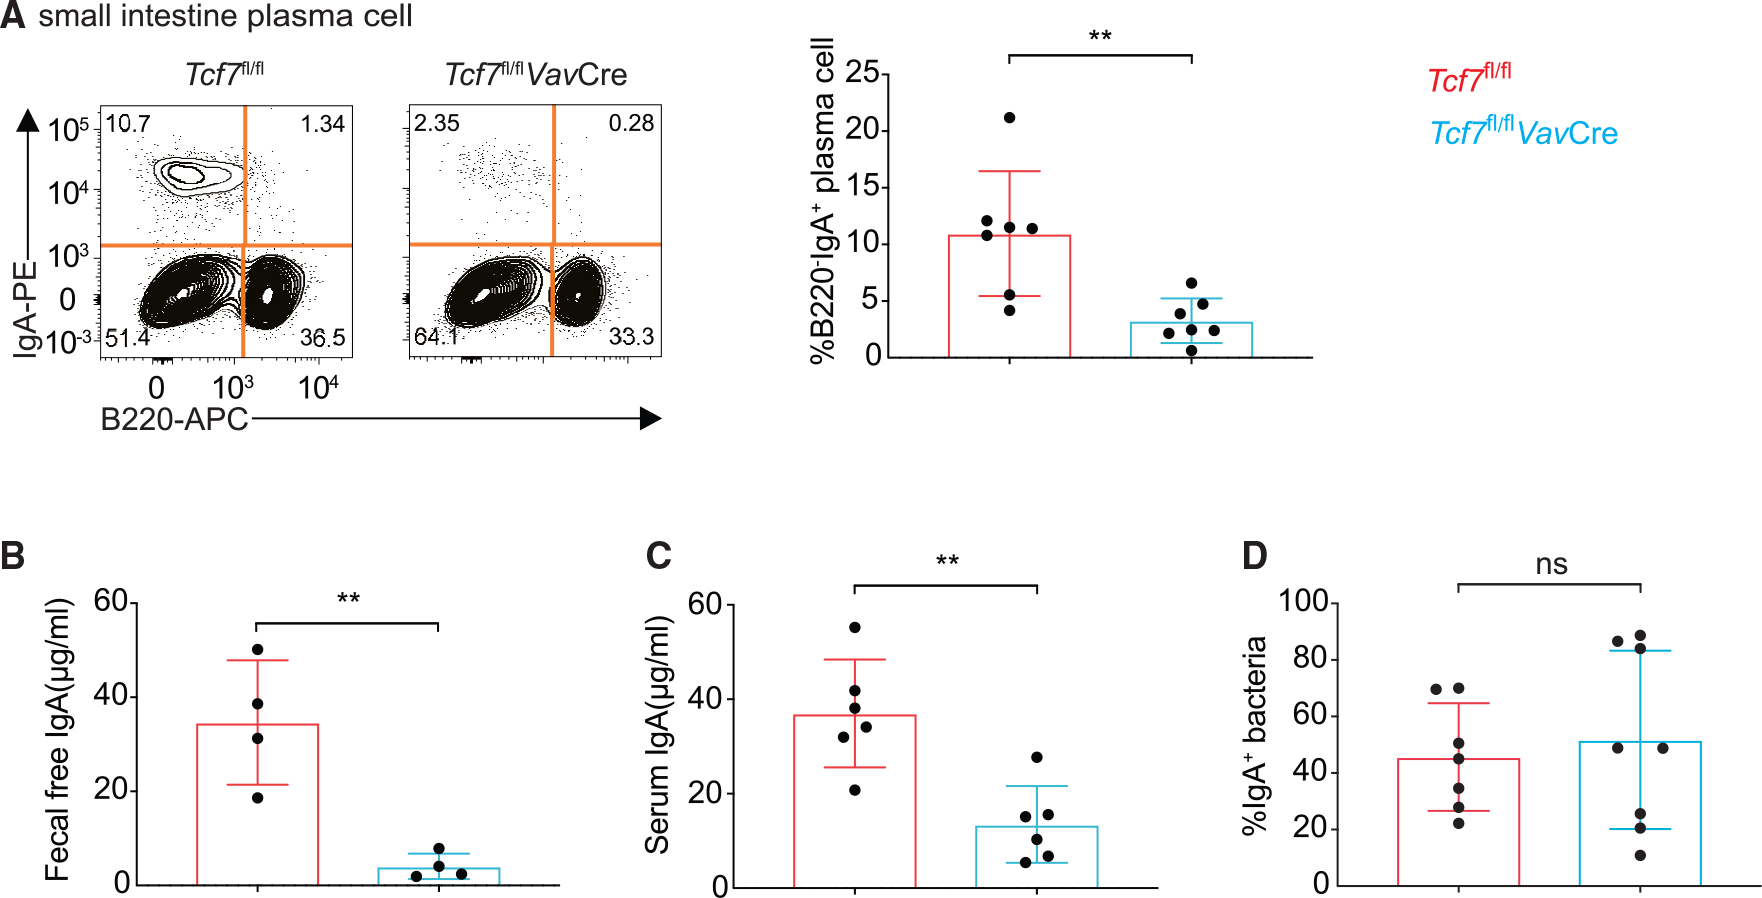
Figure 4. Impaired IgA production in the small intestine of young Tcf7fl/flVavCre mice.

(A) Flow cytometric analysis and quantification of B220− IgA+ plasma cells in 4-week-old WT and Tcf7fl/flVavCre mice.
(B and C) Fecal free and serum IgA in above mice detected by ELISA assay.
(D) Quantification of IgA+ bacteria in above mice. Each symbol represents an individual mouse. Mean ± SD; n = 6–8; **p < 0.01; ns, not significant, Student’s t test. Data are representative of two independent experiments. See also Figure S4.
