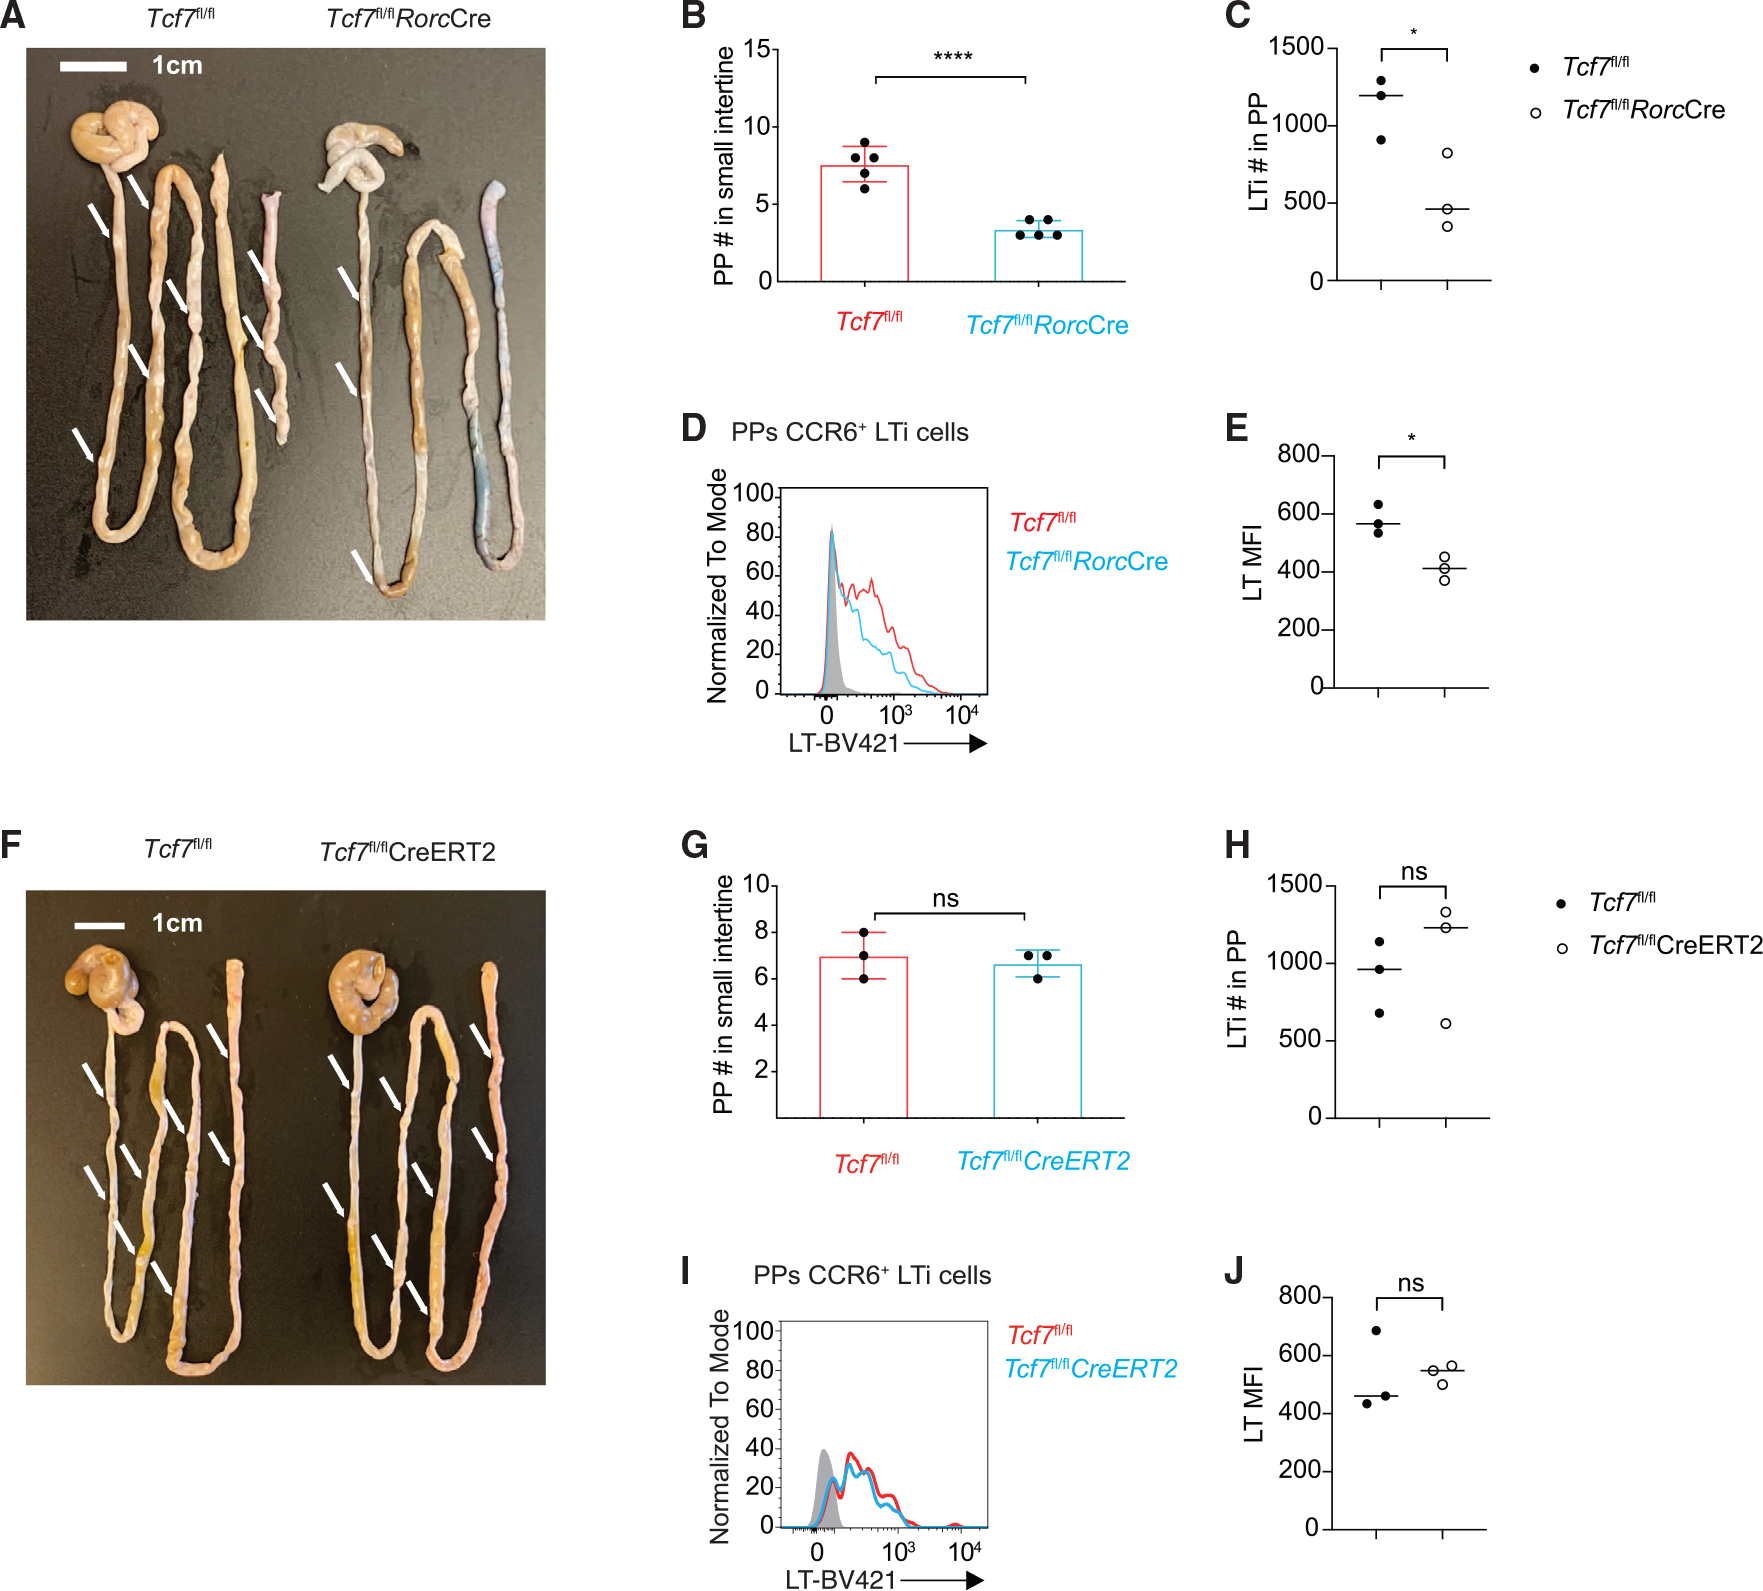
Figure 6. The role of TCF-1 in PP formation is developmental stage specific.

(A) Visualization of PPs from WT and Tcf7fl/flRorcCre mice.
(B) Quantification of PPs from the mice in (A). Each symbol represents an individual mouse.
(C) Bar graphs show quantification of total LTi cell numbers.
(D) Flow cytometric analysis of lymphotoxin expression in LTi cells from the PPs of WT and Tcf7fl/flRorcCre mice.
(E) Quantification of LT MFI from (D).
(F) Visualization of PPs from TMX-treated WT and Tcf7fl/flCreERT2 mice.
(G) Quantification of PPs from the mice in (F). Each symbol represents an individual mouse.
(H) Bar graphs show quantification of total LTi cell numbers.
(I) Flow cytometric analysis of lymphotoxin expression in LTi cells from the PPs of TMX-treated WT and Tcf7fl/flCreERT2.
(J) Quantification of LT MFI from (I). Each symbol represents an individual mouse. Mean ± SD; n = 4; *p < 0.05; ****p < 0.0001; ns, not significant, Student’s t test. Data are representative of two independent experiments. See also Figure S6.
