
Figure 7. TCF-1 directly and indirectly regulates Lta expression in PP LTi cells.
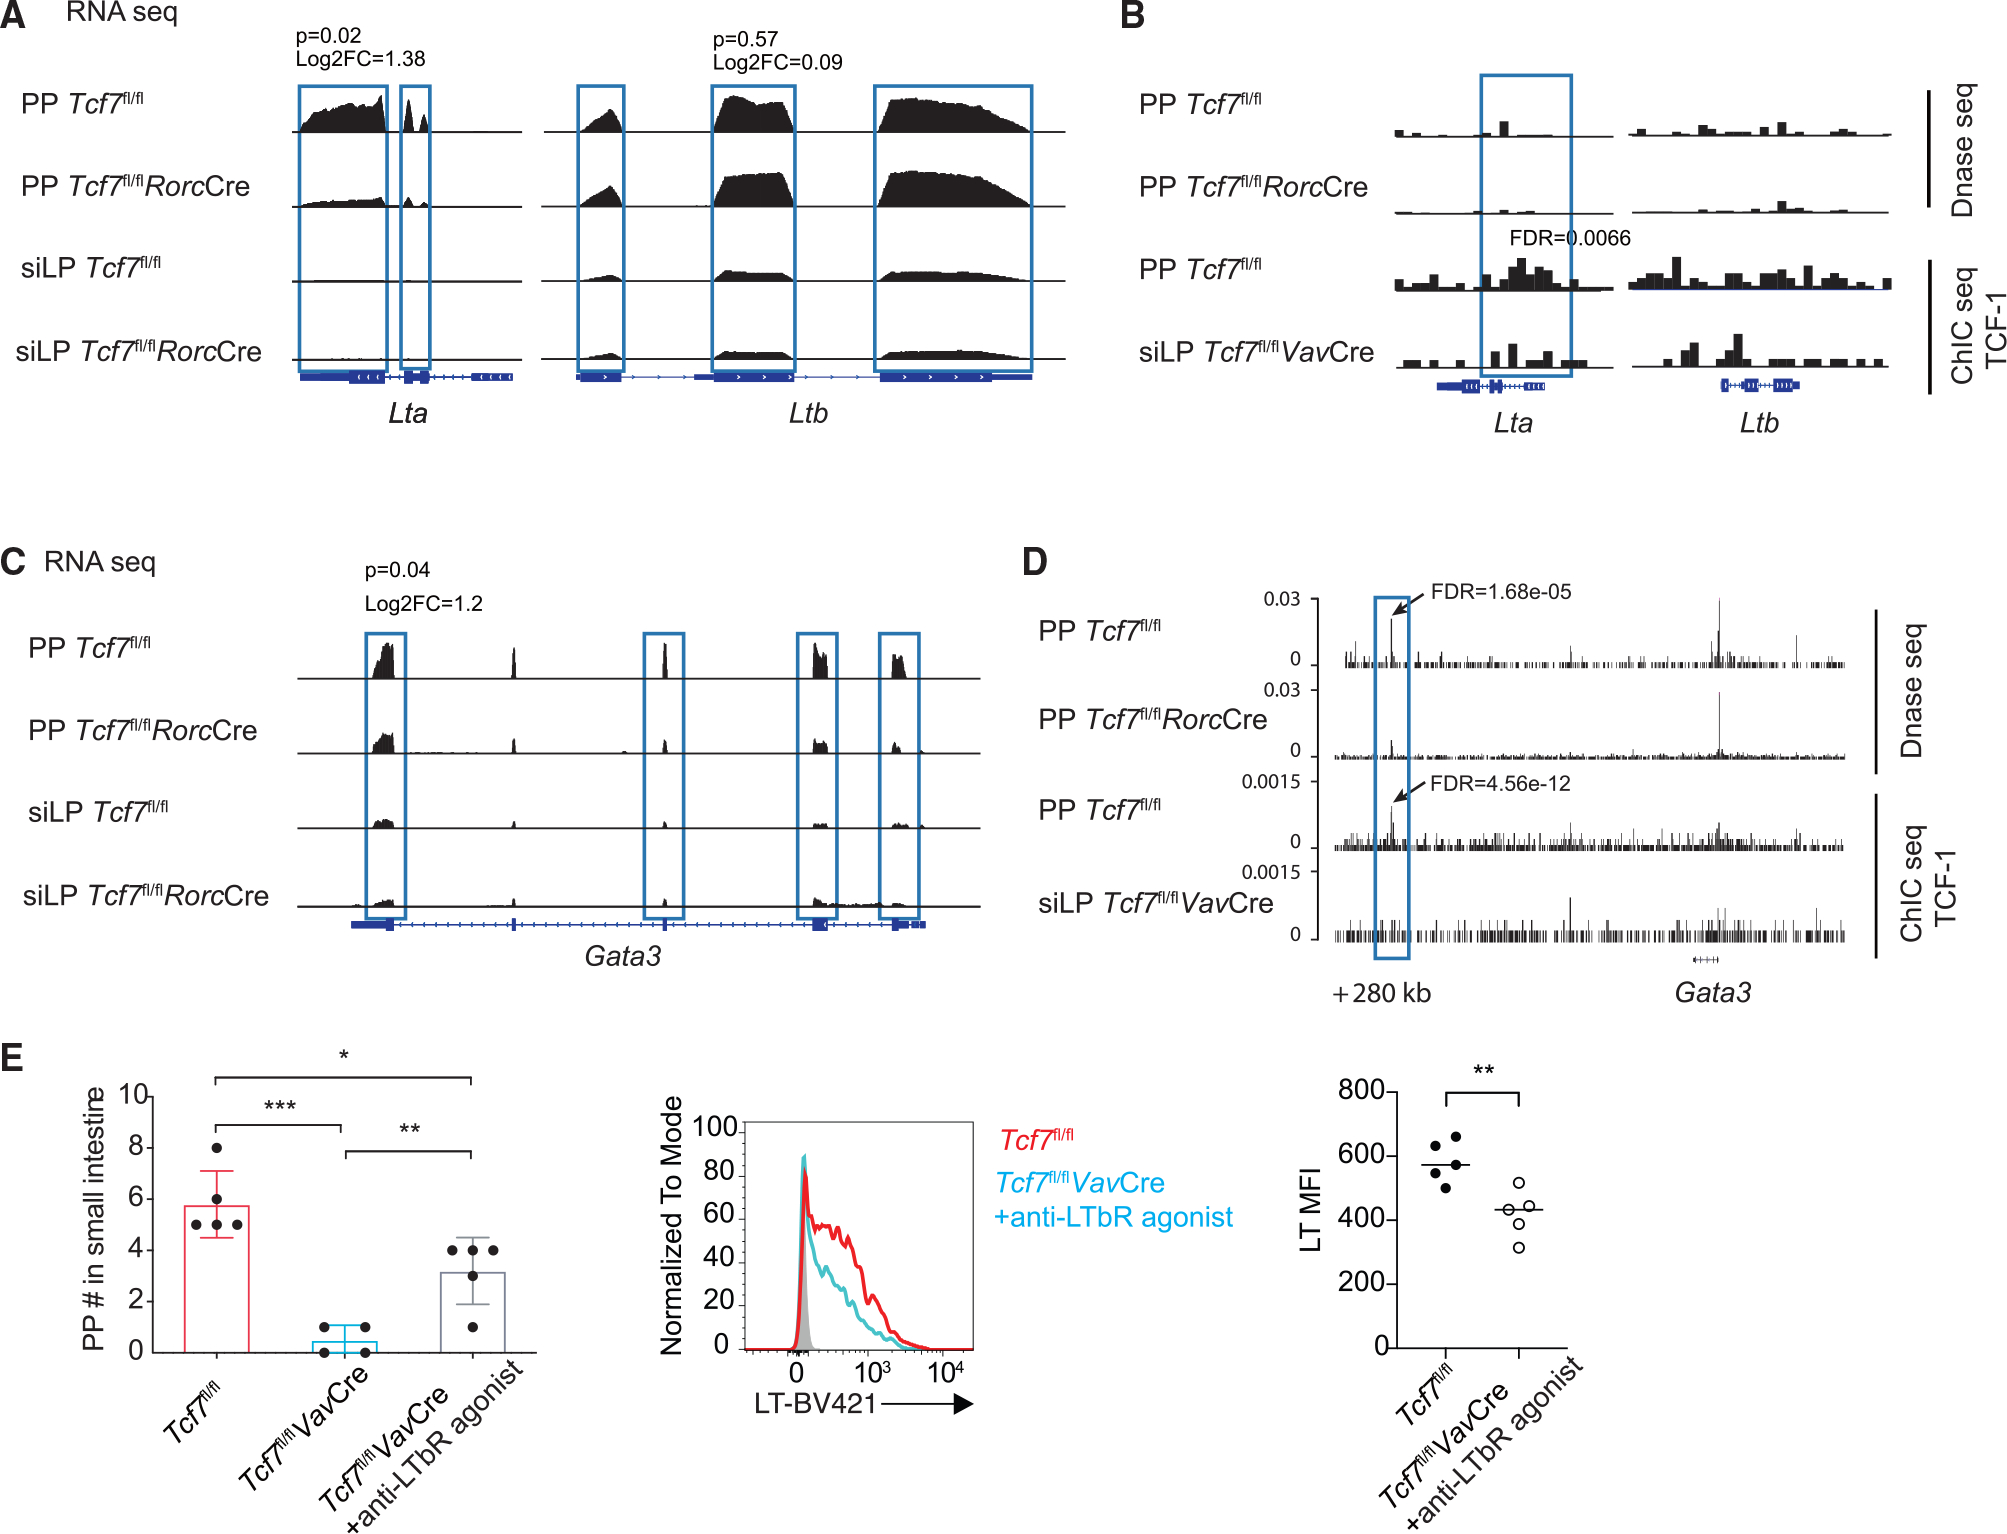
(A and C) Genome Browser snapshot showing the expression of Lta and Ltb (A) and Gata3 (C) gene in Tcf7fl/fl and Tcf7fl/flRorcCre siLP LTi cells by using RNA-seq assay.
(B and D) Genomic snapshots of the Lta/Ltb loci (B) and Gata3 (D) gene regions showing the chromatin accessibility status and density of TCF-1 ChIC-seq reads in PP LTi cells from Tcf7fl/fl and Tcf7fl/flRorcCre mice. Tcf7fl/flVavCre siLP LTi cells serve as negative control group.
(E) Quantification of PPs from LTβR agonist-treated WT and Tcf7fl/flVavCre mice. Each symbol represents an individual mouse. Flow cytometric analysis of lymphotoxin expression in LTi cells from the PPs of LTβR agonist-treated WT and Tcf7fl/flVavCre mice. Quantification of LT MFI. Mean ± SD; n = 4–5 in (E); *p < 0.05, **p < 0.01, ***p < 0.001, Student’s t test. Data are representative of two independent experiments. See also Figure S7.