Fig. 3.
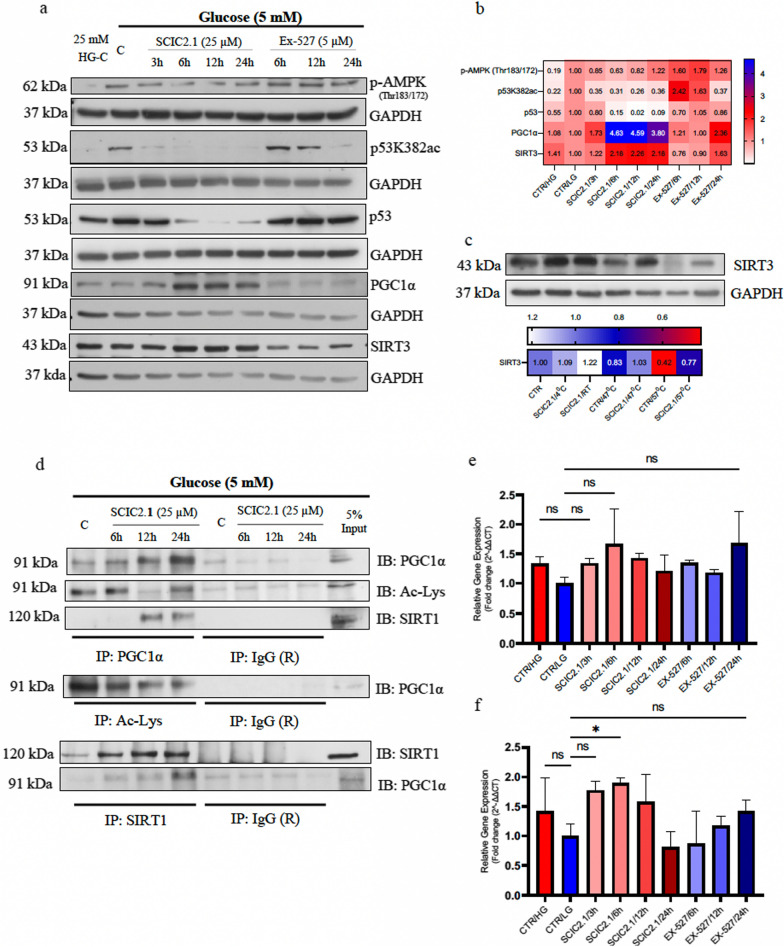
SIRT1 activation by SCIC2.1 significantly increases mitochondrial functions through the AMPK-p53-PGC1α axis upon glucose deprivation. a Western blot analysis of pAMPK (Thr183/172), p53K382ac, p53, PGC1α, and SIRT3 in HepG2 cells treated with SCIC2.1 and Ex-527 at the indicated concentrations and time points. Heat map showing band quantification of protein expression. c CETSA assay performed on HepG2 cells treated with SCIC2.1 at 25 µM and the western blot analyses showing SIRT3 protein expression. Heat map showing quantification of SIRT1 bands determined by ImageJ software. Heat map showing quantification of SIRT 3 bands determined by ImageJ software. d Immunoblots showing the expression of PGC1α, acetyl-lysine and SIRT1 after the treatment with SCIC2.1 (25 µM) at indicated time points. e SIRT3 mRNA fold expression and f PGC1α mRNA fold expression evaluated after the treatment with SCIC2.1 and Ex-527 at the indicated time points. Error bars represent the SD of three biological replicates Statistical significance was calculated using the student t-test or one-way ANOVA using GraphPad Prism 9.4.0, and statistical significance is expressed as *p-value < 0.05, nsp-value > 0.05 vs control

