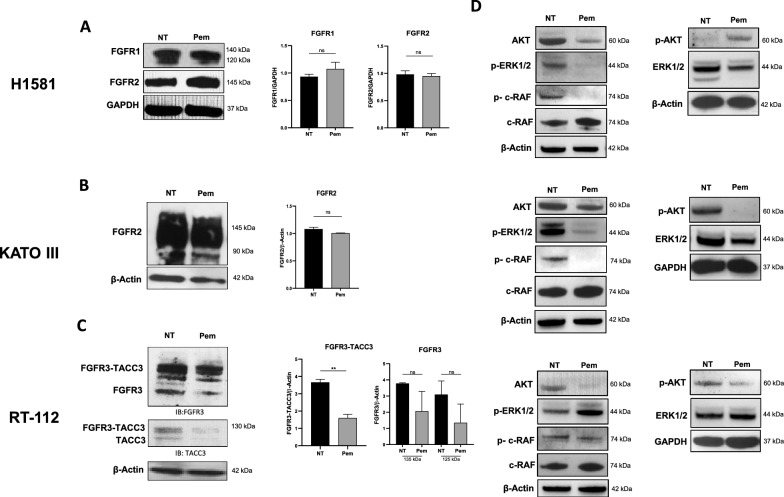
Fig. 1.
FGFR expression profile in cancer cell lines and downstream signaling pathways. A Expression of FGFR1 and 2 in H1581 lung cancer cells by Western blot. GAPDH was employed as reference marker for relative protein expression and histograms represent the relative band intensity calculated as mean ± SEM of three independent experiments. B Expression of FGFR2 in KATO III gastric cancer cells by Western blot. β-actin was employed as reference marker for relative protein expression and histograms represents the relative band intensity calculated as mean ± SEM of three independent experiments. C Expression of FGFR3 and FGFR3-TACC3 fusion in RT-112 bladder cancer cell line by Western blot analysis. The FGFR3 western blot (left panel) recognizes both native FGFR3 and the FGFR3-TACC3 fusion protein with slightly higher molecular weight. The TACC3 western blot (panel below) recognizes both native TACC3 and the FGFR3-TACC3 fusion protein with slightly higher molecular weight. β-actin was employed as reference marker for relative protein expression and histograms represent the relative band intensity calculated as mean ± SEM of three independent experiments. D Western blot analysis of c-RAF/p–c-RAF, AKT/p-AKT, ERK1/2/p-ERK1/2 in untreated (NT) and treated (Pem) H1581 (upper panels), KATO III (middle panels) and RT-112 (bottom panels) cells. GAPDH and β-actin were employed as reference markers. **p < 0.01; ns, not significative

