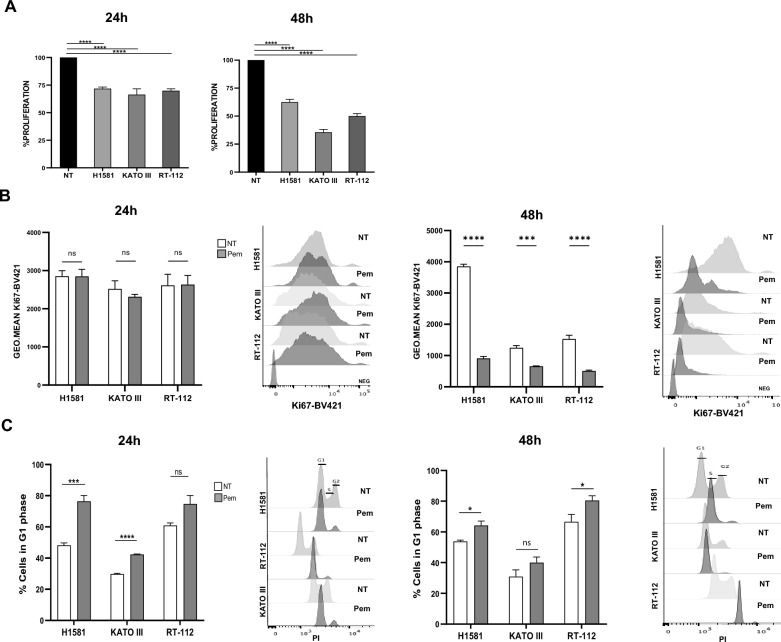
Fig. 2.
Pemigatinib treatment modulates proliferation and cell cycle arrest in cancer cell lines. A Effect of Pem (100 nM) on the proliferation of H1581, KATO III and RT-112 cells after 24 h and 48 h; B The flow cytometry histogram plots and bar-plots represent the mean ± SEM of Ki67-BV421 geometric mean of fluorescence in untreated (NT) and Pem-treated (100 nM) H1581, KATO III and RT-112 cells. C Effect of Pem (100 nM) on the G1 phase-cell cycle. Cell cycle analysis was performed by propidium iodide (PI) staining by flow cytometry. The flow cytometry histogram plots are representative of the cell cycle of one experiment at 24 h and 48 h and the histogram bar-plots represent the count of PI-positive cells found in G1 phase in untreated (NT) and Pem-treated (100 nM) H1581, KATO III and RT-112 cells; All experiments are represented as the mean of three independent experiments ± SEM. *p < 0.05; **p < 0.01; ***p ≤ 0.001; ****p ≤ 0.0001. Student’s t test

