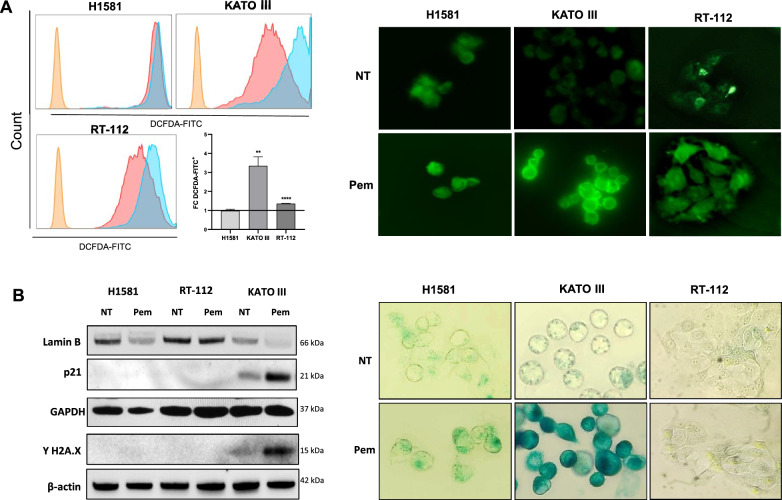
Fig. 4.
Effect of pemigatinib on ROS and senescence in cancer cell lines. A Flow cytometry plots (left panel) and immunofluorescence staining (40 × magnification) with DCFH-DA probe (right panel) of intracellular ROS in cancer cells untreated and treated with Pem (100 nM). The histogram results are plotted as the fold change in the MFI of the treated (light blue) vs. the untreated samples (pink) of three independent experiments. *p < 0.05; **p < 0.01; ***p ≤ 0.001. B Cellular senescence. Western blot of lamin B, p21 and γ-H2A.X protein expression in untreated (NT) and treated (Pem) H1581, RT-112 and KATO III cells at 48 h. GAPDH and β-actin were used as reference markers (left panel). β-Galactosidase staining of untreated and Pem-treated H1581, KATO III and RT-112 cells at 48 h was assessed with a magnification of 40X under a Leyca microscope (right panel). The β-Galactosidase staining assay was performed in three independent experiments

