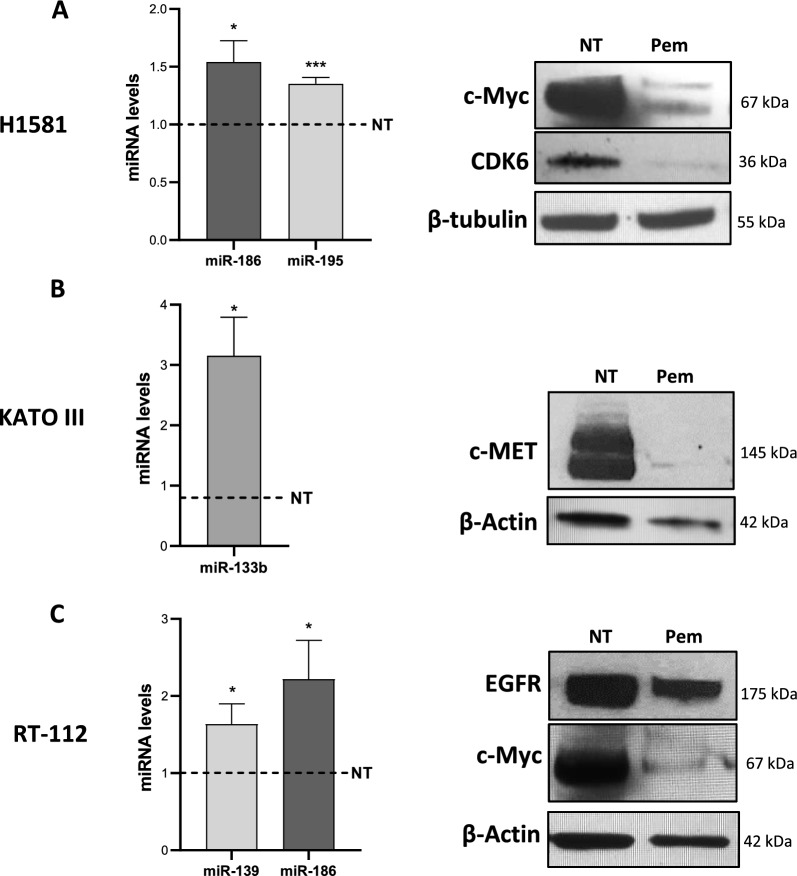
Fig. 5.
Expression levels of selected miRNA and protein targets in cancer cell upon pemigatinib treatment. A Left: histograms show the expression of miR-186 and miR-195 and right: Western blots of CDK6, target of miR-195, and c-Myc, target of miR-186 and miR-195 in H1581 cells treated with Pem for 48 h. B Left: histogram showing the expression of miR-133b and right: Western blots of MET, a target of miR-133b, in KATO III cells treated with Pem for 48 h. C Left: histogram showing the expression of miR-139 and miR-186 and right: Western blots of EGFR, target of miR-139, and c-Myc, target of miR-186, in RT-112 cells treated with Pem for 48 h. Histograms represent the mean ± SEM of three experiments, and the dashed line indicates the control (NT). *p < 0.05; ***p ≤ 0.001; Student’s t-test

