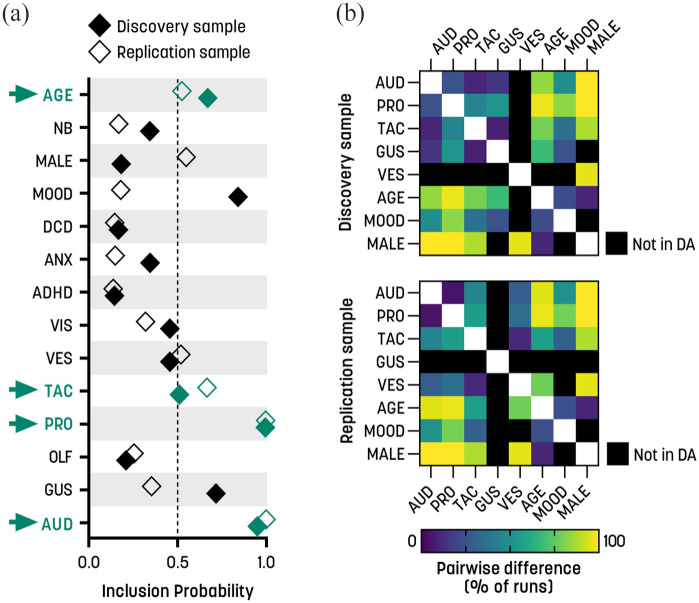
Figure 2.
Communicative QATs: stochastic search variable selection (SSVS) and dominance analysis. (a) Marginal inclusion probabilities for the sensory subscales and covariates for the two independent samples. The arrows highlight the predictors that exceeded the inclusion threshold of 0.5 in both samples. (b) Pairwise differences between predictors. The symmetric matrices illustrate the percentage of times that pairs of predictors were significantly different from each other in the dominance analysis, in the discovery sample (upper panel) and replication sample (lower panel). Black squares indicate that the predictor was not included in the dominance analysis due to not being selected by the SSVS (see section “Methods” for details).
ANX: anxiety conditions; ADHD: attention deficit/hyperactivity disorder; AUD: auditory; DCD: developmental coordination disorder; GUS: gustatory; MOOD: mood conditions; NB: non-binary gender; OLF: olfactory; PRO: proprioceptive; TAC: tactile; VES: vestibular; VIS: visual.

