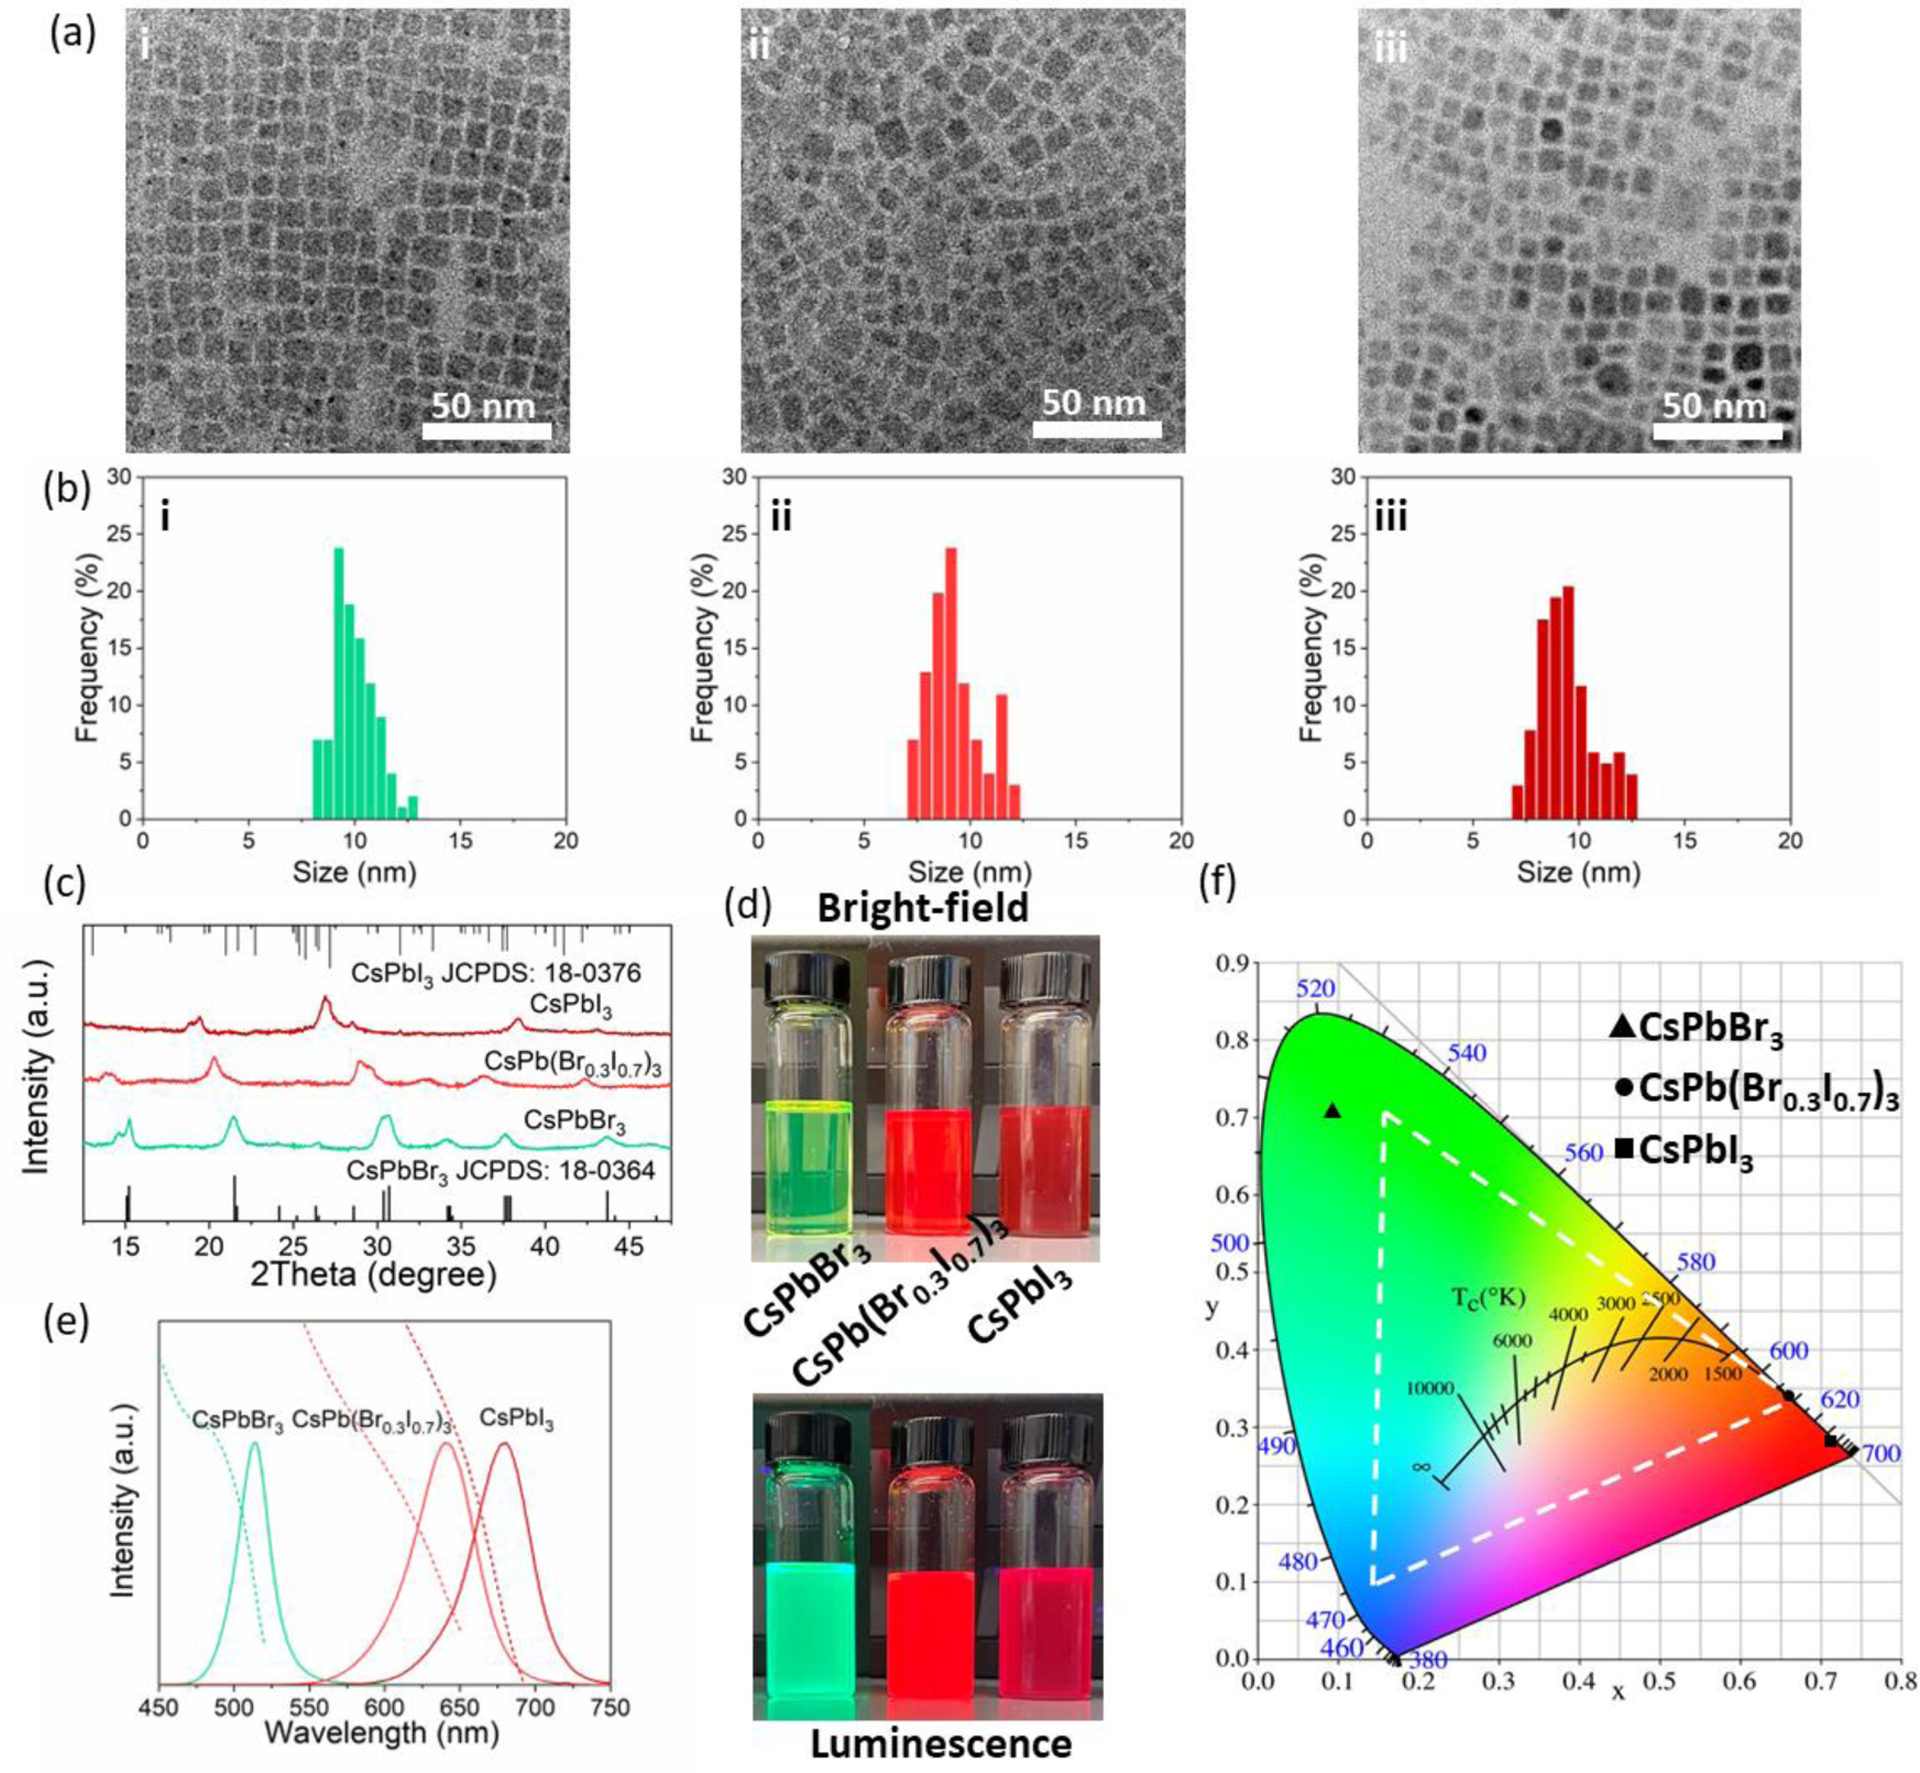
Figure 3.

Synthesis and characterizations of cesium lead halide PQDs. (a&b) Representative TEM images (a) and corresponding size distributions (b) of (i) CsPbBr3, (ii) CsPb(Br0.3I0.7)3, and (iii) CsPbI3 PQDs. (c) XRD patterns of CsPbBr3, CsPb(Br0.3I0.7)3, and CsPbI3 PQDs. (d) Brightfield (top) and luminescence (bottom) image of CsPbBr3, CsPb(Br0.3I0.7)3, and CsPbI3 PQDs dispersed in toluene. (e) Absorption (dashed lines) and photoluminescence (solid lines) spectra of CsPbBr3, CsPb(Br0.3I0.7)3, and CsPbI3 PQDs. (f) The International Commission on Illumination (CIE) chromaticity diagram overlaid with the emission color of CsPbBr3, CsPb(Br0.3I0.7)3, and CsPbI3 PQDs. The color gamut defined in the NTSC color standard is highlighted by the white dashed triangle.
