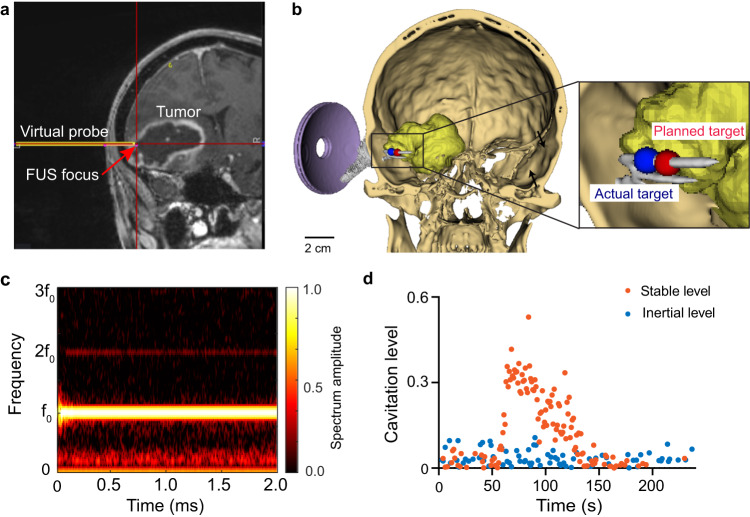
Fig. 2. Tumor targeting and treatment monitoring.
a The screenshot from the Stealth neuronavigation system shows the precise alignment of the FUS focus (arrow) with the planned target indicated by the crossing point of the red lines. b 3D reconstruction to show the spatial location of the planned target inside the tumor and the simulated FUS focus location based on the trajectory obtained from the neuronavigation system. c Representative time-frequency analysis of the acquired cavitation signals during FUS sonication to show the spectrum of the signals. d Representative stable cavitation and inertial cavitation levels measured based on the frequency spectrum of the acquired cavitation signals.

