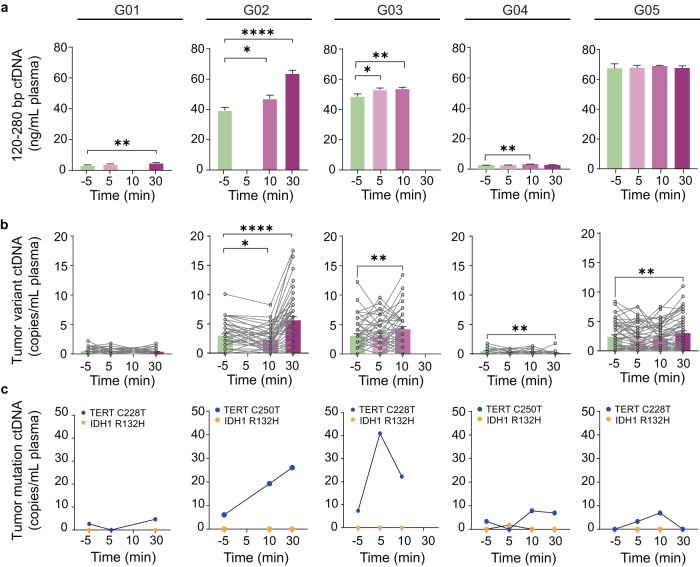
Fig. 3. Sonobiopsy enriched plasma ctDNAs.
a Plasma single nucleosome length cfDNA (120–280 bp fragments) concentrations in blood samples collected pre- and post-FUS sonication. The blood sample collection time points varied among patients. Bar graph represents mean ± standard error of the mean (SEM). *p < 0.05, **p < 0.01, ***p < 0.001, and ****p < 0.0001. Ordinary one-way ANOVA, uncorrected Fishers’ LSD comparing post-FUS time points with pre-FUS. b Plasma patient-specific tumor variant ctDNA concentrations measured using a personalized tumor-informed ctDNA assay. Bar graph represents mean ± standard error of the mean (SEM). *p < 0.05, **p < 0.01, ***p < 0.001, ****p < 0.0001. Repeated measures (RM) one-way ANOVA, uncorrected Fishers’ LSD comparing post-FUS time points with pre-FUS. c Plasma TERT and IDH1 mutation level detected by ddPCR. Data are presented for time points when the blood samples were collected.

