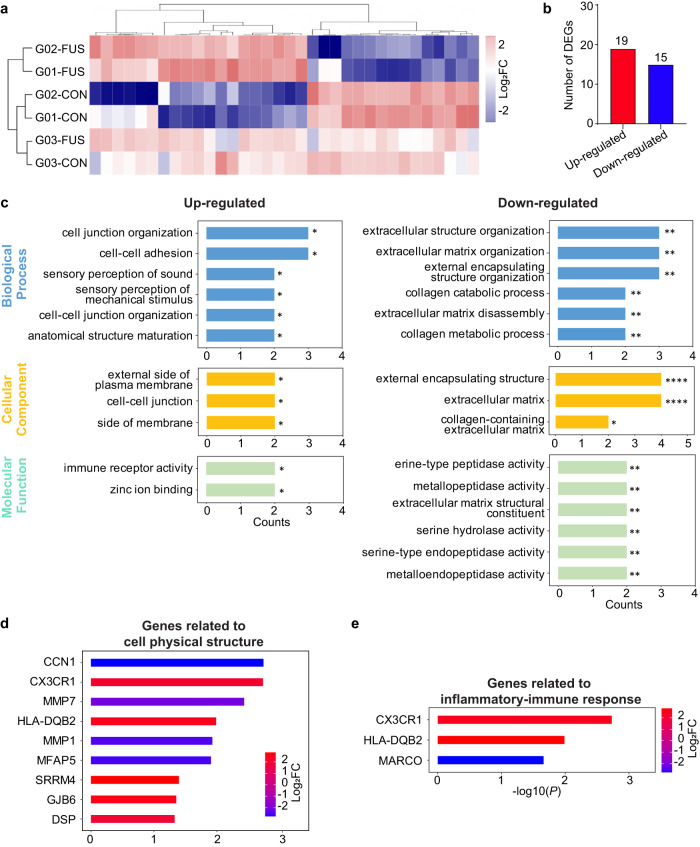
Fig. 5. Transcriptome analysis of differentially expressed genes (DEGs) after sonobiopsy.
a Hierarchical clustering heat map of all DEGs with log2FC (fold change) values > 2 and p < 0.05. Rows represent brain tissue samples acquired from the FUS-sonicated (FUS) or nonsonicated (CON) tumor regions from different patients, and columns represent individual DEGs. b Summary of the total number of upregulated and downregulated DEGs. c Upregulated (red) and downregulated (blue) DEGs with GO functional analysis for enriched biological processes, cellular components, and molecular functions. *p < 0.05, **p < 0.01, ***p < 0.001, and ****p < 0.0001. d Upregulated and downregulated genes involved in GO terms related to cell physical structure. e Upregulated and downregulated genes involved in GO terms related to inflammatory or immune-related response.

