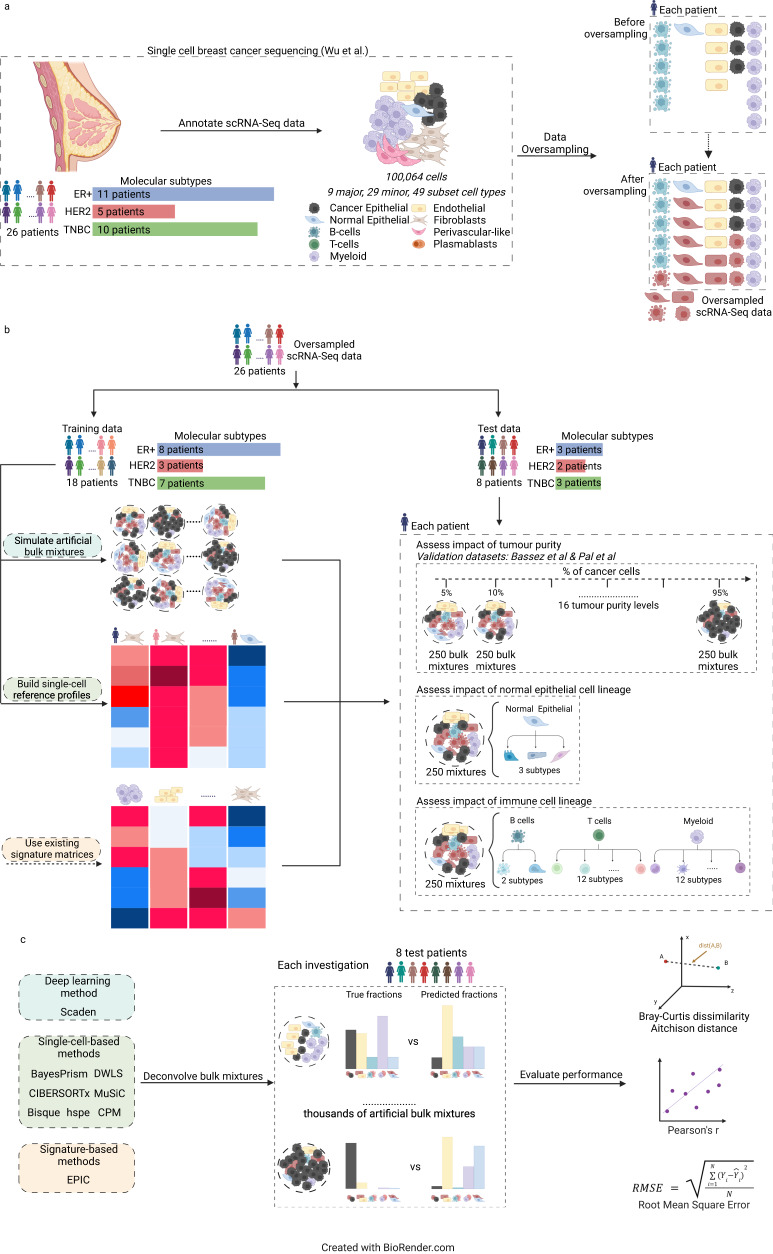
Fig. 1. Experimental design of the benchmarking study.
Workflow to benchmark performance of nine transcriptomic-based TME deconvolution methods in different biological conditions using scRNA-seq breast cancer data. a Annotated scRNA-seq data from Wu et al.15 is oversampled so that within each patient, the number of cells in the less abundant cell types matches the number in the most abundant cell type. b Oversampled scRNA-seq data are assigned to train data (n = 18 patients) and test data (n = 8 patients). Train data was used to generate either artificial bulk mixtures or single-cell reference matrix as input to the different TME deconvolution methods (left block). Test data was used to generate artificial bulk mixtures for different benchmarking investigations (tumour purity, normal epithelial cell lines, immune cell linage) (right block). c Within each investigation, the overall deconvolution performance of the nine benchmarked methods was evaluated using Bray-Curtis dissimilarity, Aitchison distance, RMSE and Pearson’s r, while the performance of predicting individual components was assessed using RMSE. ER+: estrogen receptor positive, HER2+: Human Epidermal growth factor Receptor 2 positive, TME: tumour microenvironment, TNBC: triple-negative breast cancer, RMSE: Root Mean Square Error, scRNA-seq: single-cell RNA sequencing. Figure was made using BioRender.com.

