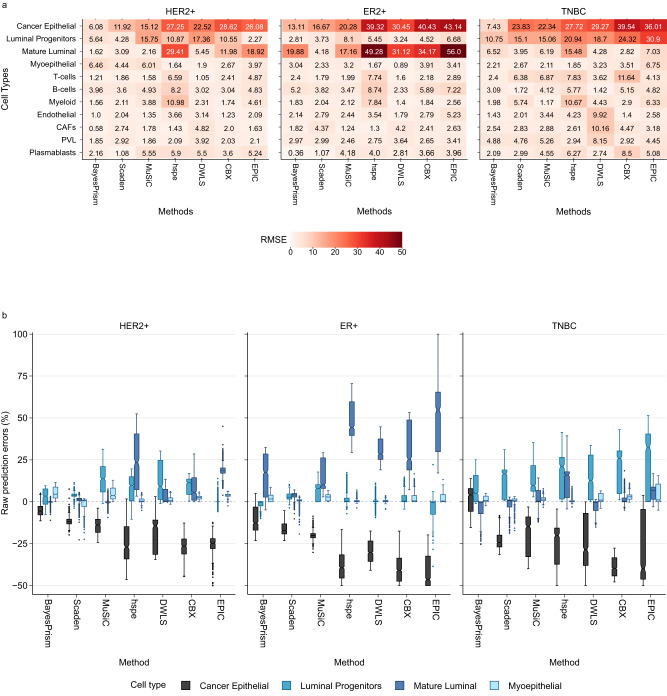
Fig. 3. Impact of normal epithelial lineages and molecular subtypes on deconvolution.
a RMSE between predicted and actual cell compositions, aggregated by molecular subtypes (HER2+, ER+ and TNBC). Darker shade of red represents higher RMSE values and poorer performance, with numeric RMSE values shown. Cell types (y-axis) are organised into four categories: cancer epithelial, normal epithelial (luminal progenitors, mature luminal and myoepithelial), immune (T-cells, B-cells and myeloid), and stromal cells (endothelial, CAFs, PVL and plasmablasts). CAFs: Cancer Associated Fibroblasts, PVL: Perivascular-like, RMSE: Root Mean Square Error. b Raw prediction errors of seven methods, BayesPrism, Scaden, MuSiC, CBX, DWLS, hspe and EPIC, for cancer epithelial and three minor subtypes of normal epithelial cells aggregated by molecular subtypes (HER2+, ER+ and TNBC). Higher positive and lower negative raw prediction errors represent poorer performance. Mixtures were synthesised at a fixed purity level of 50% using three minor cell types of normal epithelial cells and eight other major cell types (cancer epithelial, T-cells, B-cells, myeloid, endothelial, CAFs, plasmablasts and PVL). n = 2000 artificial bulk mixtures. Each box represents the middle 50% of raw prediction errors, which includes the first quartile (Q1), the median, and the third quartile (Q3). Upper and lower whiskers depict maxima and minima of raw prediction errors, excluding outliers. Outliers are raw prediction errors that are more than 1.5x the interquartile range from either Q1 or Q3. Zero line indicates a perfect match between prediction and ground truth. Source data are provided as a Source Data file.

