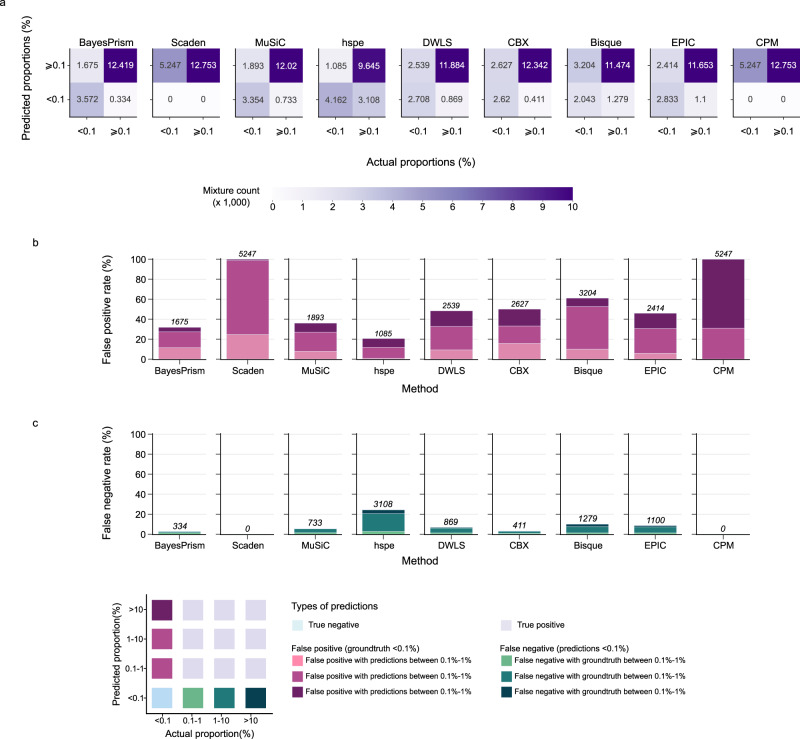
Fig. 4. The performance of the nine deconvolution methods assessed by false positive and false negative rates.
a Confusion matrices depicting all nine methods’ performance on predicting whether a cell type is absent (< 0.1%) or present (≥ 0.1%) in a mixture. For each confusion matrix, x-axis represents predicted absence/presence, y-axis represents actual absence/presence, and false positive, true positive, false negative, and true negative numbers are aggregated across all cell types. b Predicting cell type presence when cell type absent in the mixture. Percentages of the three levels of false positives out of the total number of false positives and true negatives (actual proportion <0.1%). Counts of false positives are shown above each bar for all cell types. c Predicting cell type absence when cell type present in the mixture. Percentages of the three levels of false negatives out of total number of all false negatives and true positives (predicted proportions <0.1%). Counts of false negatives are shown above each bar for all cell types. Figure legend for both (b) and (c) illustrates definitions of true negative, false positive, true positive, and false negative predictions. The more accurate a method in predicting presence/absence, the lower false positive rates and false negative rates are. Source data are provided as a Source Data file.

