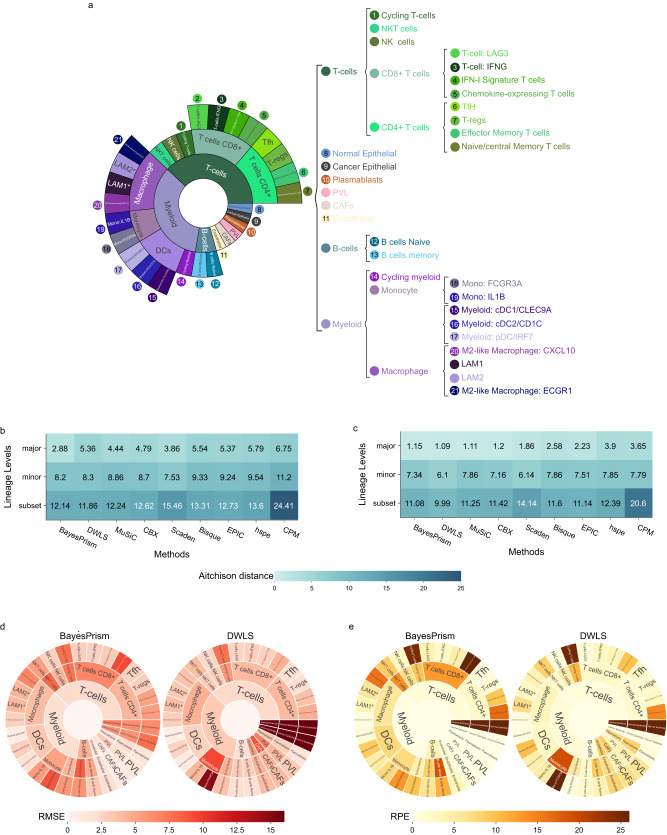
Fig. 5. Impact of immune lineages on deconvolution.
a The relationship of immune cells in the major, minor and subset cell types. b, c Aitchison distance between predicted and actual compositions of 2000 mixtures containing 23 subset cell types of T-cells, B-cells and myeloid at 50% tumour purity level. The median Aitchison distance across 2000 mixtures is shown for each of the nine methods using either b all cell types or c only immune cell types. Lighter shade of teal indicates smaller Aitchison distance and between performance. RMSE (red) (d) and RPE (orange) (e) between predicted and actual cell proportions of BayesPrism and DWLS, aggregated into major, minor and subset cell types. Darker shades of red and orange represent higher RMSE and RPE values and poorer performance, respectively. Cancer epithelial, normal epithelial, endothelial, CAFs, PVL and plasmablast cell types were used for artificial bulk simulation at all three levels and, therefore, possess three sets of RMSE and RPE values across the lineage levels. Several minor immune cell types, such as NK cells or memory B-cells, do not have any subset cell types and were therefore re-used at the subset level, resulting in two sets of RMSE and RPE values at minor and subset level. RMSE: Roost Mean Square Error, RPE: relative proportion error. Source data are provided as a Source Data file.

