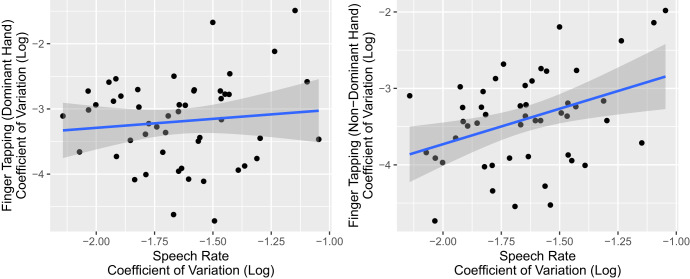
Fig. 2. Correlation between variability in speech rate and variability in finger-tapping rate in the read speech task.
We observe a significant positive relationship between variability in speech rate and variability in finger-tapping rates in the non-dominant hand (left plot), but not the dominant hand (right plot). Each point represents one participant; the line of best-fit is shown, with shaded regions showing standard errors of the regression fit.

