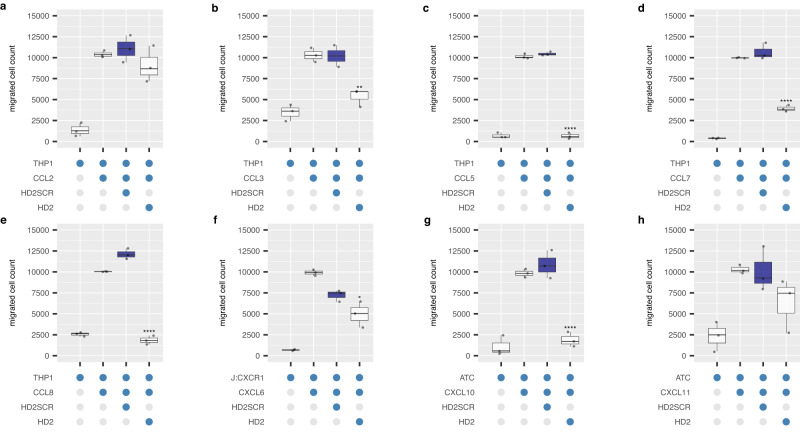
Fig. 5. Effect of exemplar peptide on chemotaxis.
a–h Box-whisker plots showing the effect of the exemplar peptide HD2 on cell migration induced by indicated human chemokines. All experiments were performed as three technical and three biological replicates, and individual biological replicate data points (mean of technical replicates) are shown. Y-axis in each panel shows cell count normalised to the median value of migrated cells in the presence of chemokine alone, set at 10000 cells. X-axis shows constituents of each experiment as blue-filled dots. Chemokine and cell type names are indicated. HD2SCR is a scrambled version of HD2 used as negative control. All peptides were at 10 μM final concentration and chemokines at EC80 doses. Each box-whisker plot shows the median as centre, 25th and 75th percentile as bounds, and 1.5*interquartile range as whiskers. Statistically significant differences (compared to control, coloured blue, n = 3 biologically independent experiments per group), were identified using a two-sided Dunnett’s test with correction for multiple comparisons and are indicated by asterisks: ****p ≤ 0.0001, ***p ≤ 0.001, **p ≤ 0.01. Exact p-values by panel are: (b) p = 0.009456; (c–e) p = 0.000000; (f) p = 0.033149; (g) p = 0.000016. Source data are provided as a Source Data file.

