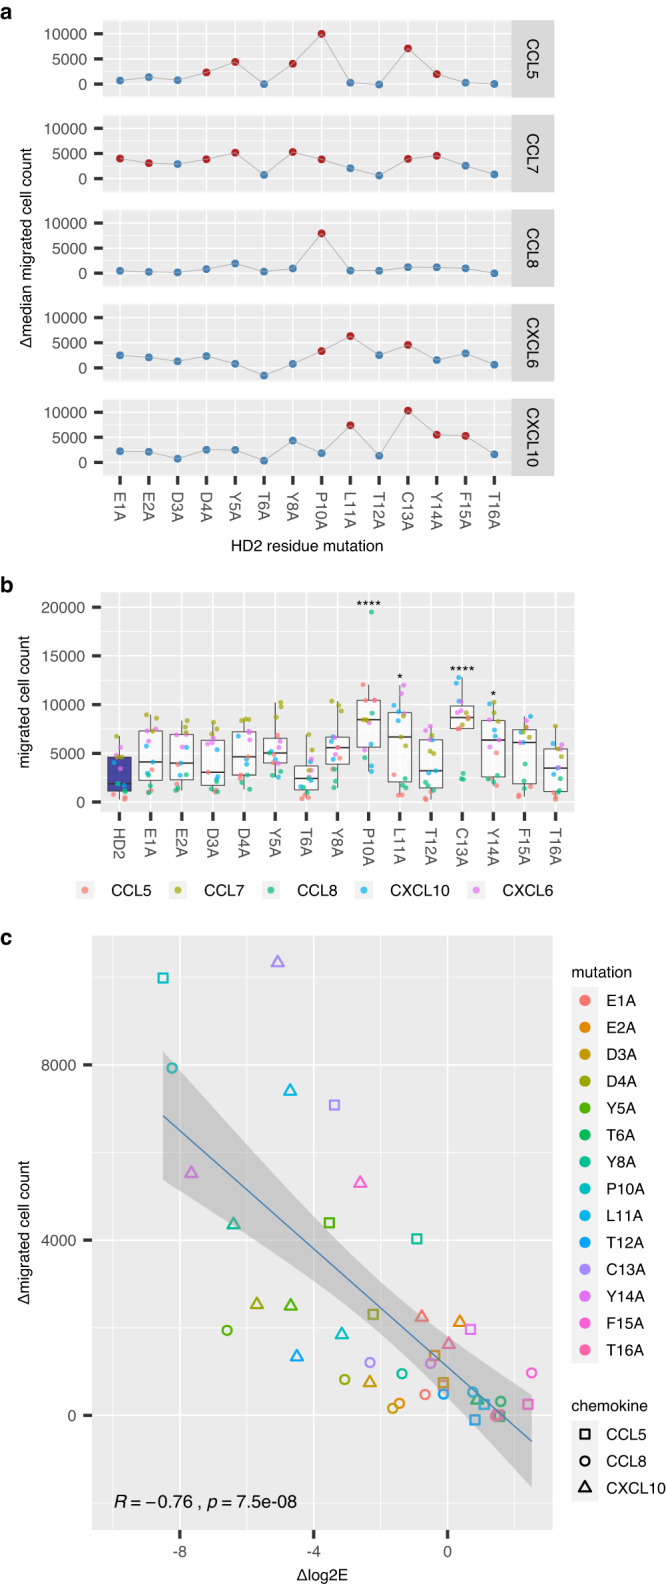
Fig. 8. Effect of HD2 alanine mutations on chemotaxis.

a Faceted plots of change in median migrated cell count between alanine mutant and wild-type HD2 peptide obtained in cell migration assays (Y-axis, Δmedian migrated cell count) versus alanine mutated residue (X-axis). Chemokines used for each experiment are indicated in the strip to the right of each plot. Statistically significant differences compared to parental HD2 are shown as red dots. b Box-whisker plot showing impact of HD2 residue mutation to alanine (X-axis) upon migrated cell count (Y-axis) for all chemokines studied. All experiments were performed as three biological replicates, and individual data points are indicated, and coloured by the chemokine used. The box-whisker plot shows the median as centre, 25th and 75th percentile as bounds, and 1.5*interquartile range as whiskers. Statistically significant differences (compared to control, coloured blue), using Dunnett’s test with correction for multiple comparisons, are indicated by asterisks: ****p ≤ 0.0001, ***p ≤ 0.001, **p ≤ 0.01, *p ≤ 0.05, n = 15 observations per group (three biological replicates for each chemokine). Exact p-values are: C13A 1.62e−05; L11A 2.86e−02; P10A 2.79e−06; Y14A 4.17e−02. c Correlation of phage binding and inhibitory potency for alanine mutant HD2 peptides. Scatterplot of Δmedian migrated cell count (Y-axis, obtained in cell migration assays) versus Δlog2E (X-axis, obtained in phage-display experiments) for peptide:chemokine pairs. Individual data points indicate peptide chemokine pairs for which both cell migration and Δlog2E were available. Linear regression plot with 95% confidence interval, Spearman correlation coefficient (R) and statistical significance (p) are shown. Source data are provided as a Source Data file.
