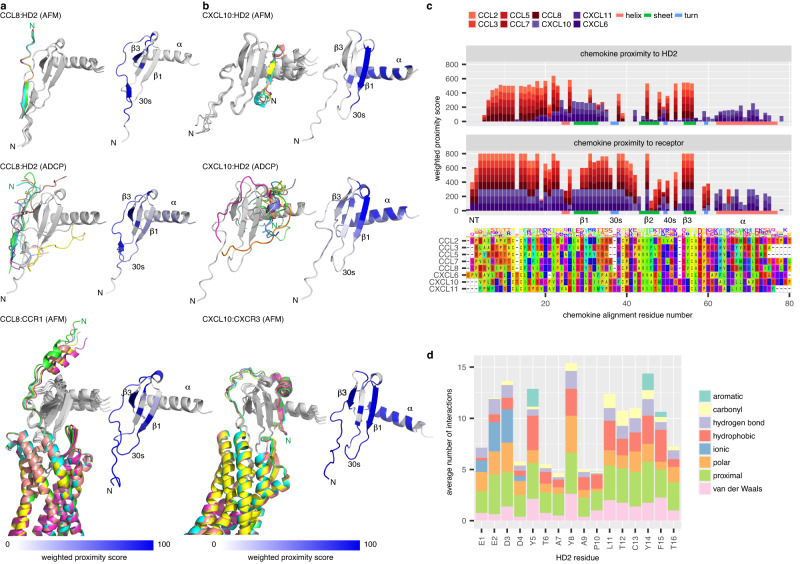
Fig. 9. Predicted binding modes of HD2 and receptors to chemokines.
a Left panels: Ribbon diagrams showing predicted poses for CCL8:HD2 using AlphaFold2-Multimer (top) or AutoDock CrankPep (middle) and for CCL8:CCR1 using AlphaFold2-Multimer (bottom). Chemokines are in grey, and the peptide or receptor in colour, with the top-ranked pose coloured green. Right panels: Corresponding heatmaps of weighted proximity scores mapped onto ribbon diagrams of CCL8. b Left panels: Ribbon diagrams showing predicted poses for CXCL10:HD2 using AlphaFold2-Multimer (top) or AutoDock CrankPep (middle) and for CXCL10:CXCR3 using AlphaFold2-Multimer (bottom). Right panels: Corresponding heatmaps of weighted proximity scores mapped onto ribbon diagrams of CXCL10. c Stacked bar charts of weighted proximity scores (Y-axis) for HD2 (top panel) and for receptor (middle panel), plotted for each chemokine residue (X-axis) following multiple sequence alignment (bottom panel). Models of chemokine:HD2 and chemokine:receptor (CCL2:CCR2, CCL3:CCR1, CCL5:CCR5, CCL7:CCR1, CCL8:CCR1, CXCL10:CXCR3, CXCL11:CXCR3 and CXCL6:CXCR1) were generated using AlphaFold2-Multimer. Secondary structural elements for CCL8 are indicated at the bottom of the top and middle panels. Chemokines and secondary structural elements are coloured as indicated in the legend. Amino acid residues are coloured using the Taylor scale. d Stacked bar chart of chemokine:HD2 interchain interactions identified by Arpeggio from AlphaFold2-Multimer predictions. X-axis shows HD2 peptide residue and Y-axis the average number of interactions per residue. Interaction types are coloured as shown in the legend; “proximal” indicates residues within 5 Å of the chemokine chain. NMR nuclear magnetic resonance, AFM AlphaFold2-Multimer, ADCP AutoDock CrankPep, N N-terminus of the top-ranked pose, β1, β3 β-strands, αː α-helix. Source data are provided as a Source Data file.

