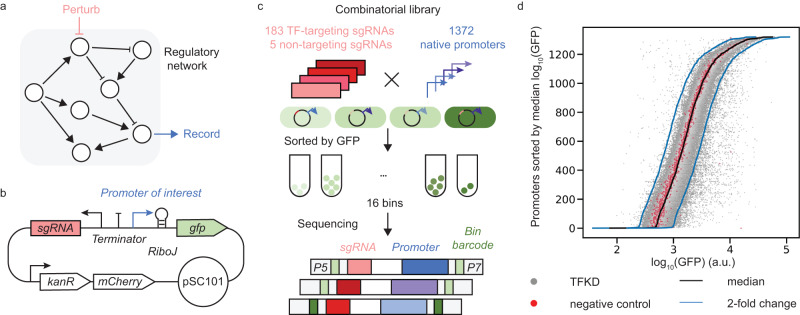
Fig. 1. Genome-wide promoter activity profiles of TFKD measured by PPTP-seq.
a Schematic of a regulatory network. Perturbing regulators and the recorded responses of genes are used to infer regulatory interactions. b Reporter plasmids used to quantify promoter activity under CRISPRi-based regulator perturbation. A native promoter was cloned upstream of the gfp gene, and a sgRNA was inserted downstream of a constitutive promoter. c Massively parallel promoter activity measurements for a combinatory library. A combinatory library of more than 2.5 × 10⁵ sgRNA-promoter pairs was sorted into 16 bins according to their GFP expression levels. The sgRNA and promoter regions in each bin were sequenced to estimate perturbed promoter activity for each sgRNA-promoter pair. d Sorted promoter activities of all promoters. The gray and red dots respectively represent promoter activities in strains with TF-targeting sgRNAs and negative control sgRNAs. The black line represents sorted median promoter activities across all TFKD conditions. The blue lines indicate 2-fold changes from the median activities. a.u. arbitrary units. Source data are provided as a Source Data file.

