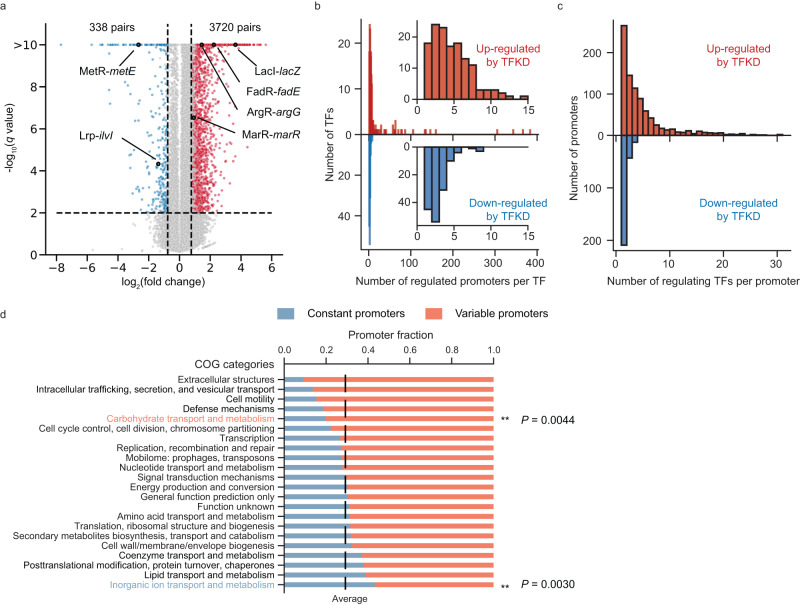
Fig. 2. Genome-wide promoter responses to TFKD in E. coli.
a Promoter activity changes by TFKD. Dashed lines indicate cutoffs for statistically significant (q < 0.01) and substantial (>1.7-fold change) effects. Each dot represents a TF-promoter pair. Upregulation and downregulation by TFKD are shown in red and blue, respectively. A few known interacting TF-promoter pairs are labeled. b Histogram of the number of regulated promoters per TF. Inset in (b) shows histograms over a smaller range. c Histogram of the number of regulating TFs per promoter. d Fractions of constant promoters and variable promoters in each COG category. All COG categories of genes in an operon controlled by a promoter are assigned to the promoter. The dashed line indicates the average fraction of constant promoters over all COG categories. Statistical significance is determined by one-sided Fisher’s exact test. **P < 0.01. Source data are provided as a Source Data file.

