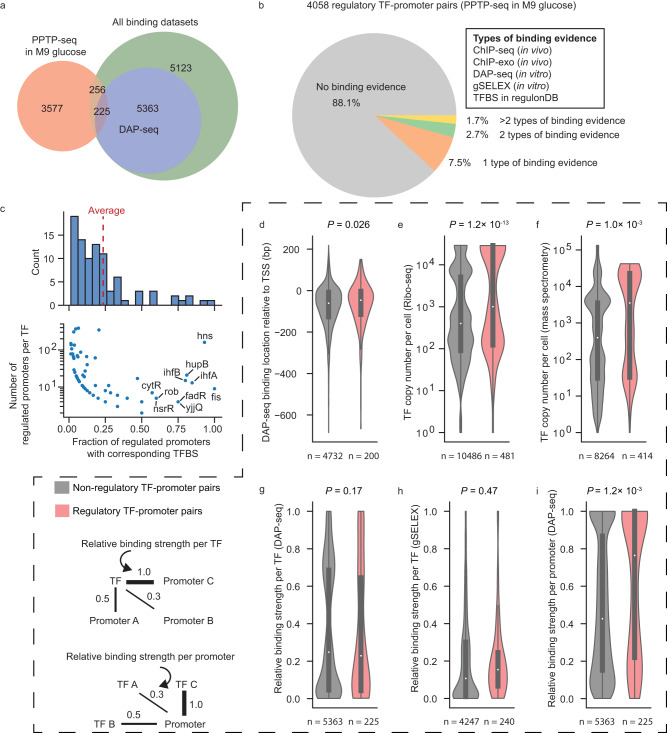
Fig. 5. Integrative analysis of promoter response and TF binding.
a Comparison of TF perturbation-response results from PPTP-seq and TF binding results. b Fraction of TF-promoter pairs that have binding evidence. c Distribution of fraction of regulated promoters with corresponding TFBS for each TF. d–h Factors that may affect whether a potentially bound TF on a promoter affects the promoter activity. For each TF-promoter binding interaction, the binding site location in DAP-seq (d), TF concentration measured by Ribo-seq (e), TF concentration measured by mass spectrometry (f), relative binding strength per TF measured by DAP-seq (g), relative binding strength per TF measured by gSELEX (h), and relative binding strength per promoter measured by DAP-seq (i) were considered. The violin plot shows the distribution of data, the central dot in the box represents the median, the box bounds represent the 25th and 75th percentiles, and whiskers represent the minima to maxima values. The number of TFBSs is indicated below. Benjamini–Hochberg adjusted P-values were calculated by the Wilcoxon rank sum test. Source data are provided in Supplementary Data 6.

