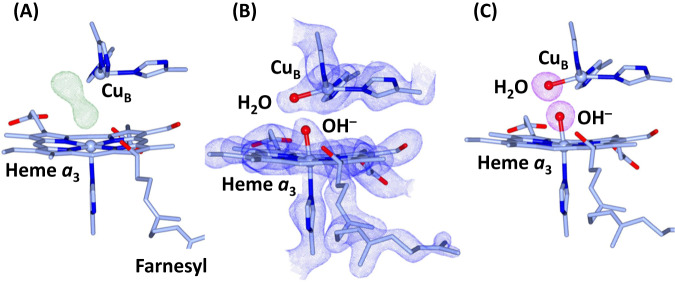
Fig. 3. Electron density maps of the BNC in the O state of bCcO.
A The FO-FC electron density map (contoured at 7.0σ) showing clear 2-lobe electron density associated with the BNC ligands. B The 2FO-FC electron density map (contoured at 2.5σ) obtained with the electron density modeled with a hydroxide ion coordinated to the heme a3 iron and a water molecule coordinated to CuB. C The Polder map (contoured at 7.0σ) associated with the BNC ligands.

